Fig. A.2.
Download original image
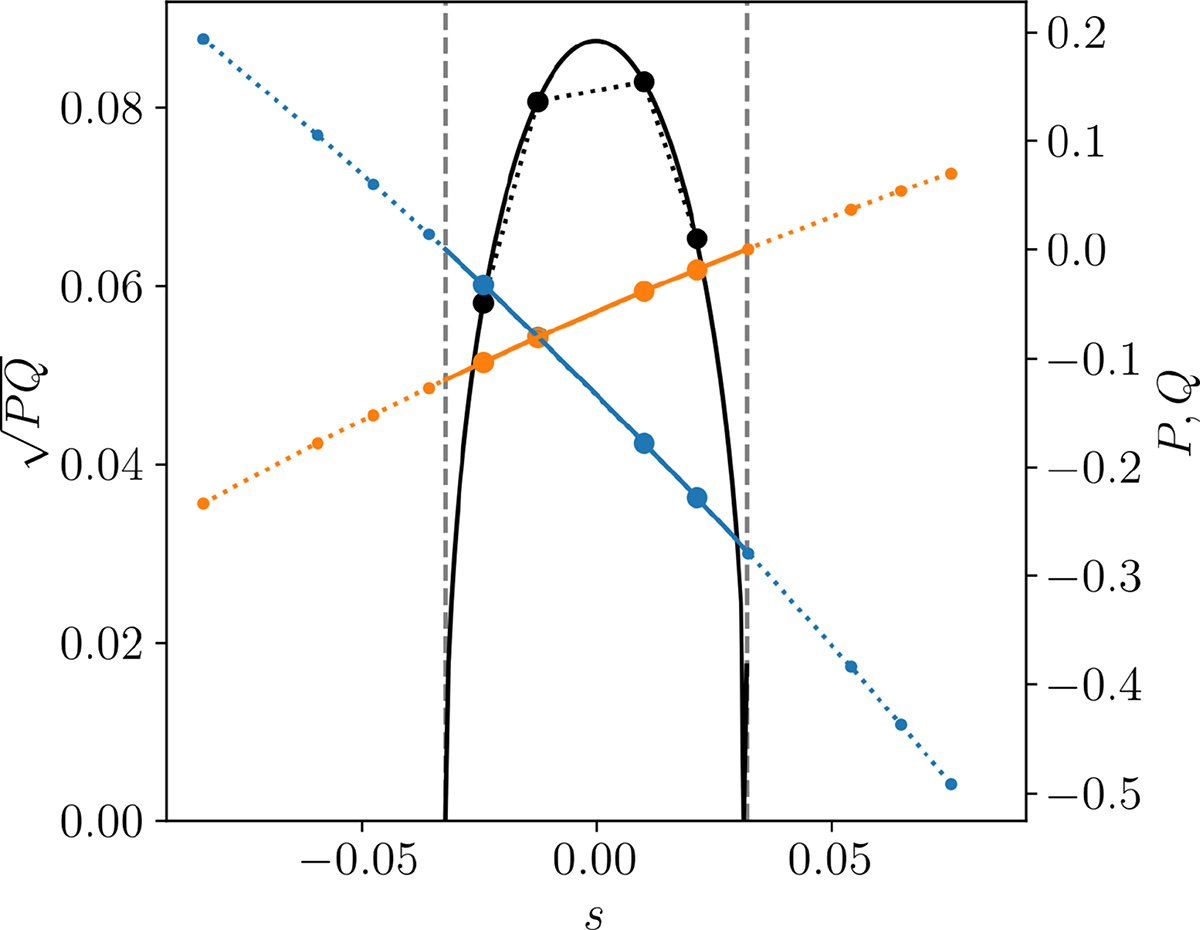
P, Q, and ![]() are shown as blue, orange, and black lines respectively. Solid lines show values calculated using the quadratic fit, and dotted lines show values using linear interpolation. The coloured circles show values at mesh points, with small circles being outside the evanescent zone and large circles inside. The vertical grey dashed lines show ±s0.
are shown as blue, orange, and black lines respectively. Solid lines show values calculated using the quadratic fit, and dotted lines show values using linear interpolation. The coloured circles show values at mesh points, with small circles being outside the evanescent zone and large circles inside. The vertical grey dashed lines show ±s0.
Current usage metrics show cumulative count of Article Views (full-text article views including HTML views, PDF and ePub downloads, according to the available data) and Abstracts Views on Vision4Press platform.
Data correspond to usage on the plateform after 2015. The current usage metrics is available 48-96 hours after online publication and is updated daily on week days.
Initial download of the metrics may take a while.