Fig. 24.
Download original image
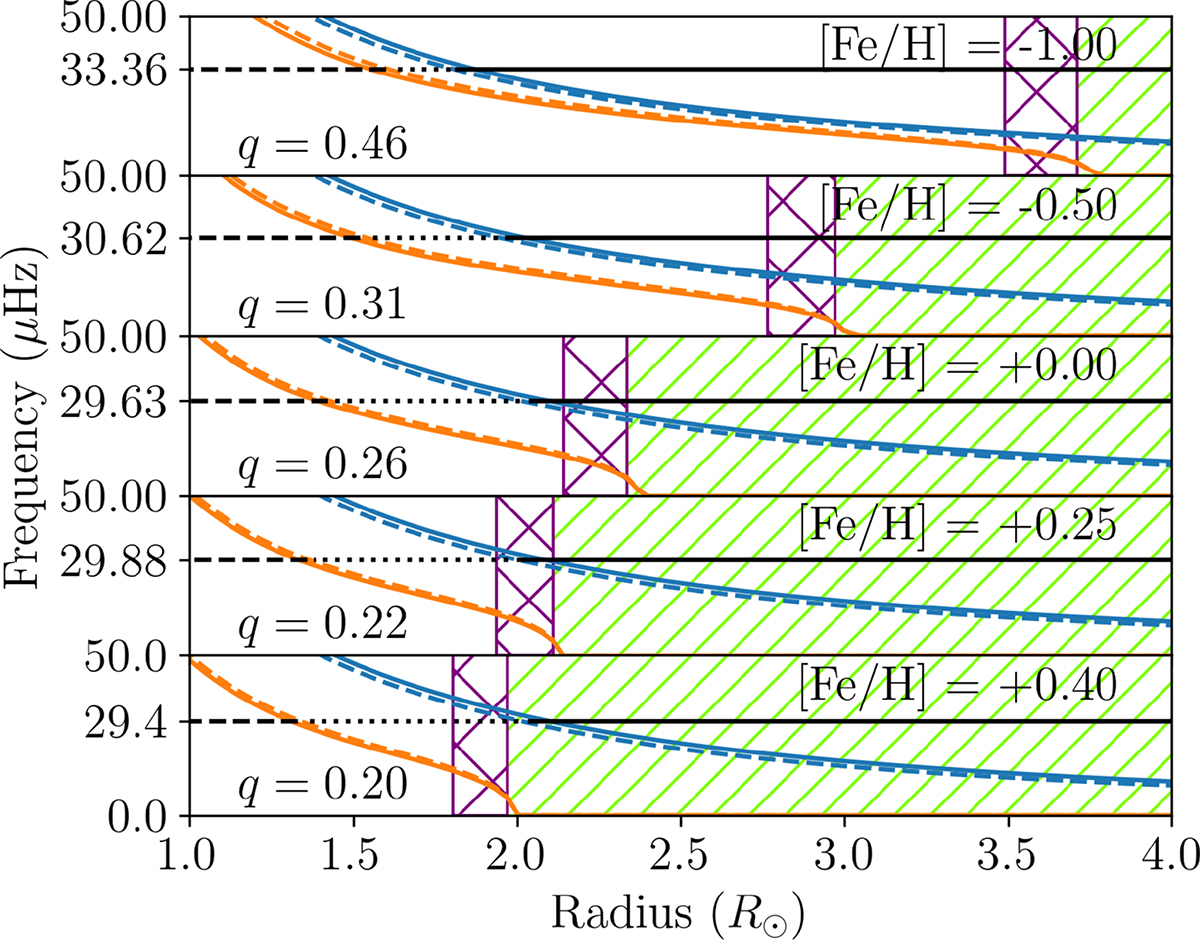
Propagation diagrams of 1 M⊙ RC models with YC ≃ 0.5 showing the Lamb (S) and reduced Lamb ![]() frequencies as blue solid and dashed lines respectively. The Brunt-Väisälä (N) and reduced Brunt-Väisälä
frequencies as blue solid and dashed lines respectively. The Brunt-Väisälä (N) and reduced Brunt-Väisälä ![]() frequencies are shown as orange solid and dashed lines respectively. νmax is shown as a horizontal black line. The green hashed regions show where the star is undergoing convection, and the purple cross-hashed region shows where convective overshoot is occurring.
frequencies are shown as orange solid and dashed lines respectively. νmax is shown as a horizontal black line. The green hashed regions show where the star is undergoing convection, and the purple cross-hashed region shows where convective overshoot is occurring.
Current usage metrics show cumulative count of Article Views (full-text article views including HTML views, PDF and ePub downloads, according to the available data) and Abstracts Views on Vision4Press platform.
Data correspond to usage on the plateform after 2015. The current usage metrics is available 48-96 hours after online publication and is updated daily on week days.
Initial download of the metrics may take a while.