Fig. 20.
Download original image
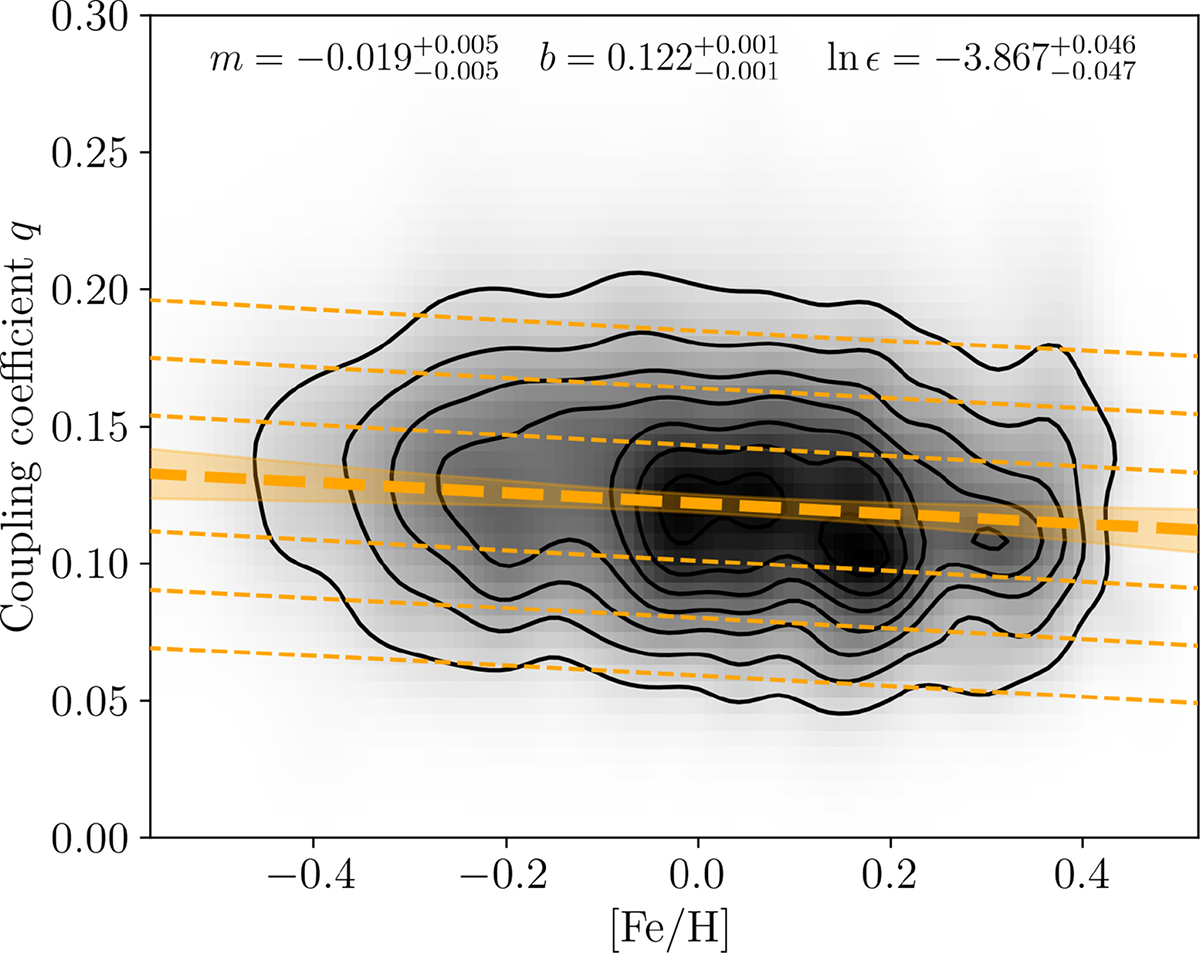
KDE of observed [Fe/H] and q for RGB stars with ΔP < 130 s. The thick orange dashed line shows the fit to the observed data, with the parameters of the fit shown at the top of the panel and Table 5. The orange shaded region shows the 3-σ confidence interval on m and b, whilst the thin orange dashed lines show the maximum-likelihood intrinsic relation in steps of 1-σ.
Current usage metrics show cumulative count of Article Views (full-text article views including HTML views, PDF and ePub downloads, according to the available data) and Abstracts Views on Vision4Press platform.
Data correspond to usage on the plateform after 2015. The current usage metrics is available 48-96 hours after online publication and is updated daily on week days.
Initial download of the metrics may take a while.