Fig. 17.
Download original image
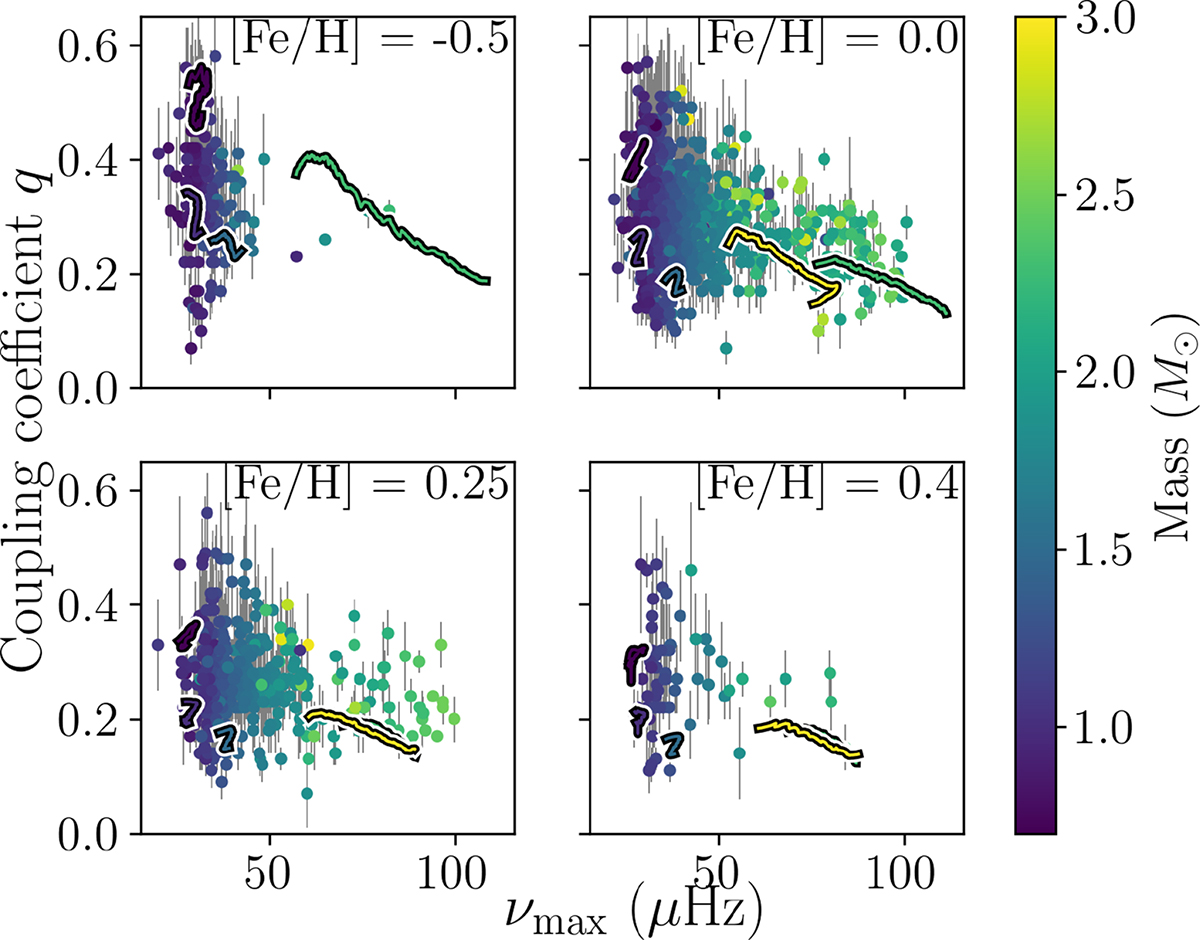
Coupling coefficient (q) at νmax versus νmax in the RC. The colour scale shows the stellar mass. The points are observed coupling and Δν and the tracks are from modelled stars. From left to right, top to bottom, the model [Fe/H] are −0.5, 0.0, 0.25, and 0.4. Similarly, the ranges for the observed [Fe/H] are −0.75 ≤ [Fe/H] ≤ −0.25, −0.25 ≤ [Fe/H] ≤ 0.125, 0.125 ≤ [Fe/H] ≤ 0.325, 0.325 ≤ [Fe/H].
Current usage metrics show cumulative count of Article Views (full-text article views including HTML views, PDF and ePub downloads, according to the available data) and Abstracts Views on Vision4Press platform.
Data correspond to usage on the plateform after 2015. The current usage metrics is available 48-96 hours after online publication and is updated daily on week days.
Initial download of the metrics may take a while.