Fig. 14.
Download original image
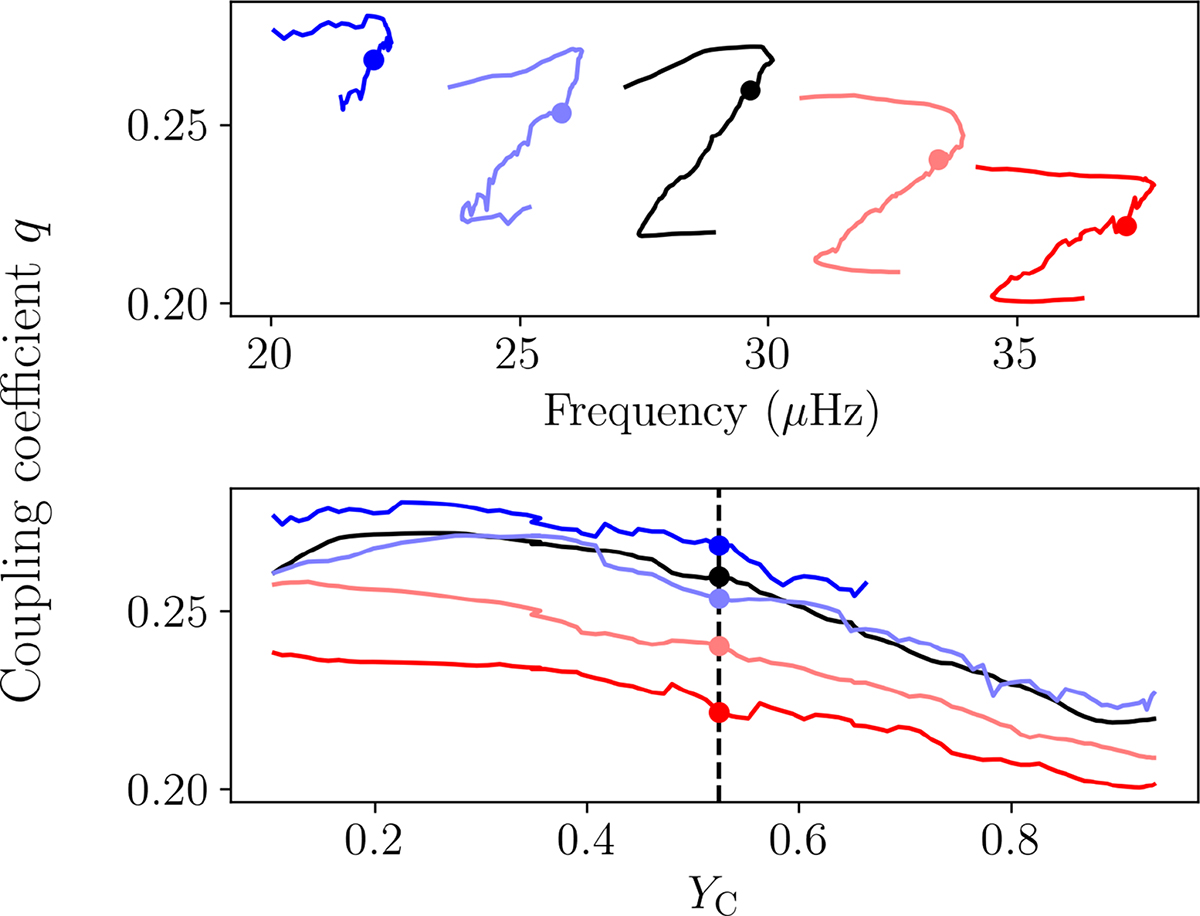
Strong-coupling coefficients as a function of frequency in the RC (top), and coupling coefficient as a function of central helium mass fraction (bottom). The black line corresponds to νq = νmax, the coloured lines correspond to νq offset from νmax in steps of Δν, with dark red being +2 Δν, light red +1 Δν, light blue −1 Δν, and dark blue −2 Δν.
Current usage metrics show cumulative count of Article Views (full-text article views including HTML views, PDF and ePub downloads, according to the available data) and Abstracts Views on Vision4Press platform.
Data correspond to usage on the plateform after 2015. The current usage metrics is available 48-96 hours after online publication and is updated daily on week days.
Initial download of the metrics may take a while.