Open Access
Fig. 12.
Download original image
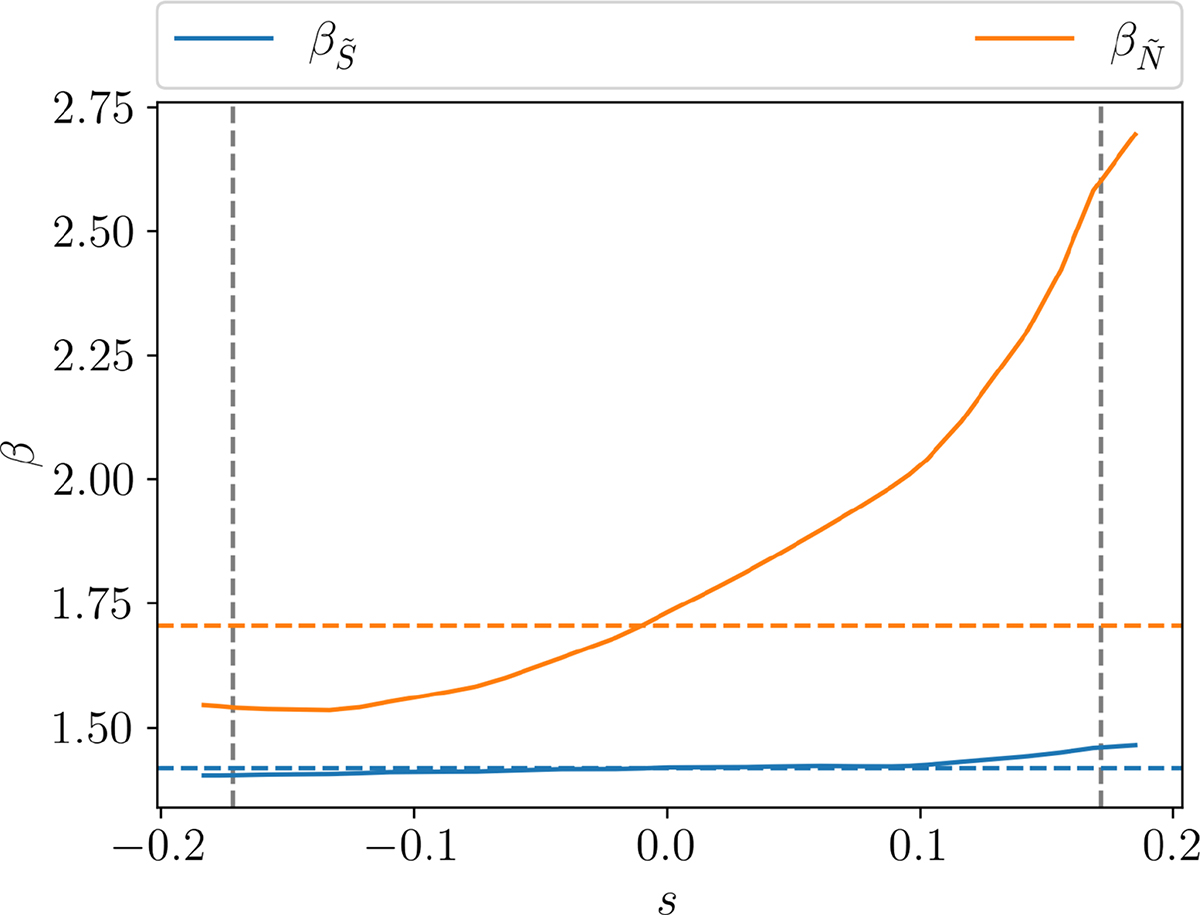
Power-law exponents ![]() and
and ![]() as a function of s of model C are shown as solid blue and orange lines respectively. The values of
as a function of s of model C are shown as solid blue and orange lines respectively. The values of ![]() and
and ![]() used in the power-laws are shown as the horizontal dashed blue and orange lines respectively. The vertical grey dashed lines show the boundaries of the evanescent zone, ±s0.
used in the power-laws are shown as the horizontal dashed blue and orange lines respectively. The vertical grey dashed lines show the boundaries of the evanescent zone, ±s0.
Current usage metrics show cumulative count of Article Views (full-text article views including HTML views, PDF and ePub downloads, according to the available data) and Abstracts Views on Vision4Press platform.
Data correspond to usage on the plateform after 2015. The current usage metrics is available 48-96 hours after online publication and is updated daily on week days.
Initial download of the metrics may take a while.