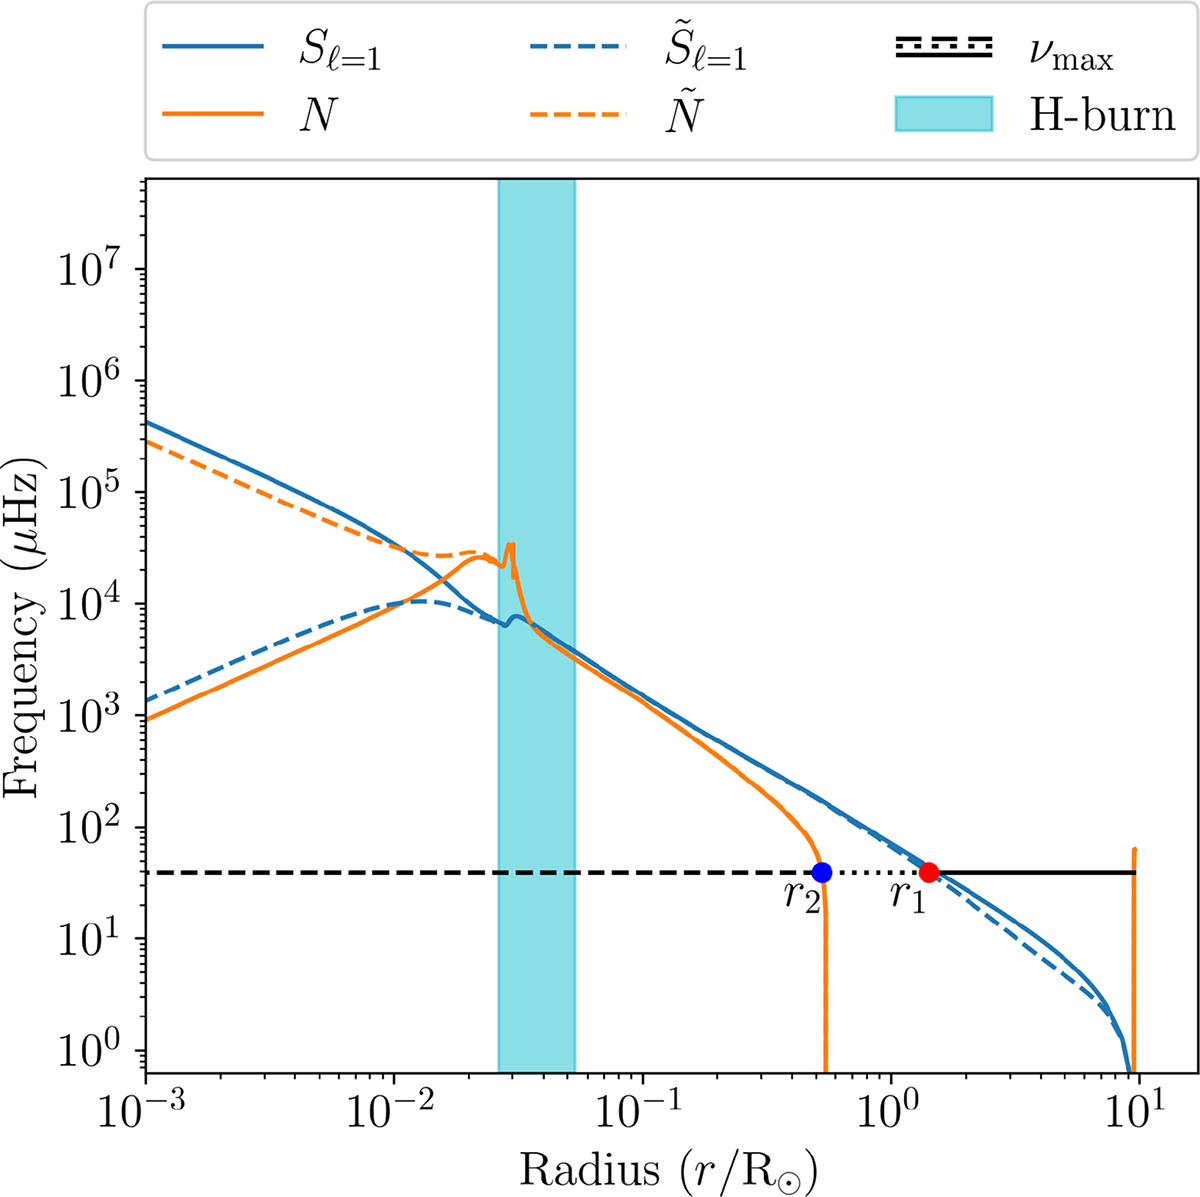
Fig. 1.
Download original image
Propagation diagram of a 1 M⊙ star in the RGB, just after the RGB bump. The Lamb and Brunt-Väisälä frequencies are shown as the solid blue and orange lines respectively. Their reduced counterparts are shown as dashed blue and orange lines respectively. A mixed mode with a frequency of νmax is shown as a dashed black line in the g-like part, as a solid black line in the p-like part, and as a dotted black line in the evanescent zone. The boundaries of the evanescent zone, r1 and r2 are shown as red and blue dots respectively. The hydrogen-burning shell is shown as the cyan shaded region.
Current usage metrics show cumulative count of Article Views (full-text article views including HTML views, PDF and ePub downloads, according to the available data) and Abstracts Views on Vision4Press platform.
Data correspond to usage on the plateform after 2015. The current usage metrics is available 48-96 hours after online publication and is updated daily on week days.
Initial download of the metrics may take a while.