Fig. 6
Download original image
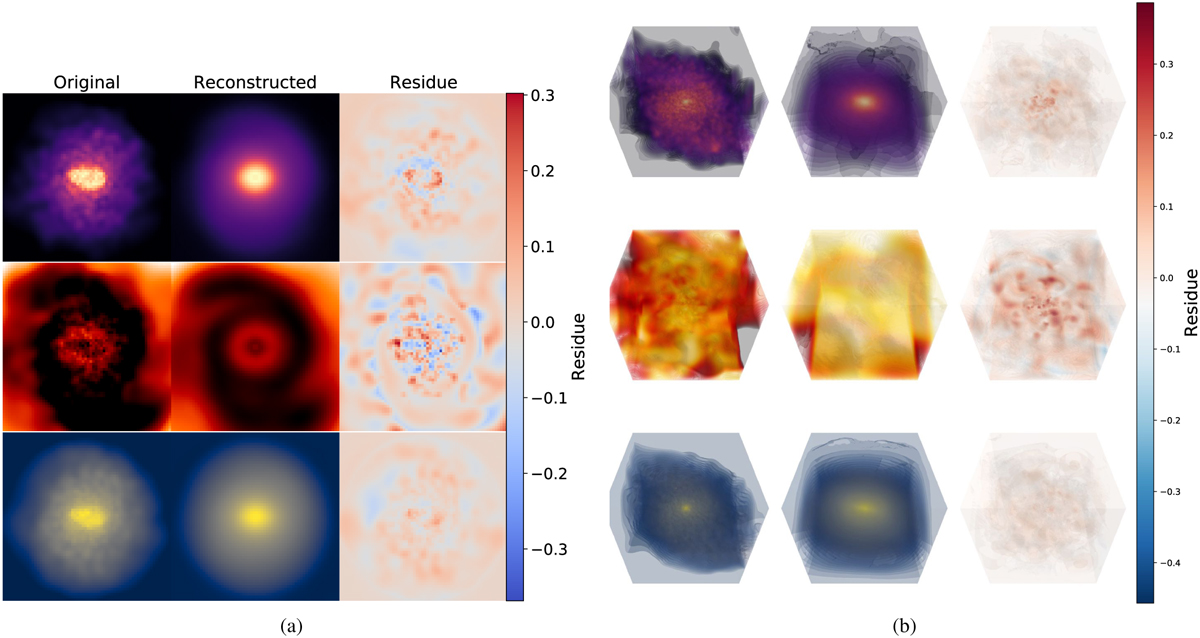
PCA reconstruction in two and three dimensions: the left most column in each panel shows a sample galaxy in the three maps (metallicity, stellar age, and mass from top to bottom) followed by the low-dimensional PCA representation with 60 (215) eigengalaxies in a) two and b) three dimensions. The rightmost column shows the residual image (Ioriginal − Irec). You can clearly see that the complex spiral structure in the Stellar Age map is approximated very well in the two-dimensional case while at the same time at n = 60 we smooth the noise in the image. Compare also with Fig. 4 for what happens in the larger n.
Current usage metrics show cumulative count of Article Views (full-text article views including HTML views, PDF and ePub downloads, according to the available data) and Abstracts Views on Vision4Press platform.
Data correspond to usage on the plateform after 2015. The current usage metrics is available 48-96 hours after online publication and is updated daily on week days.
Initial download of the metrics may take a while.