Fig. A.3
Download original image
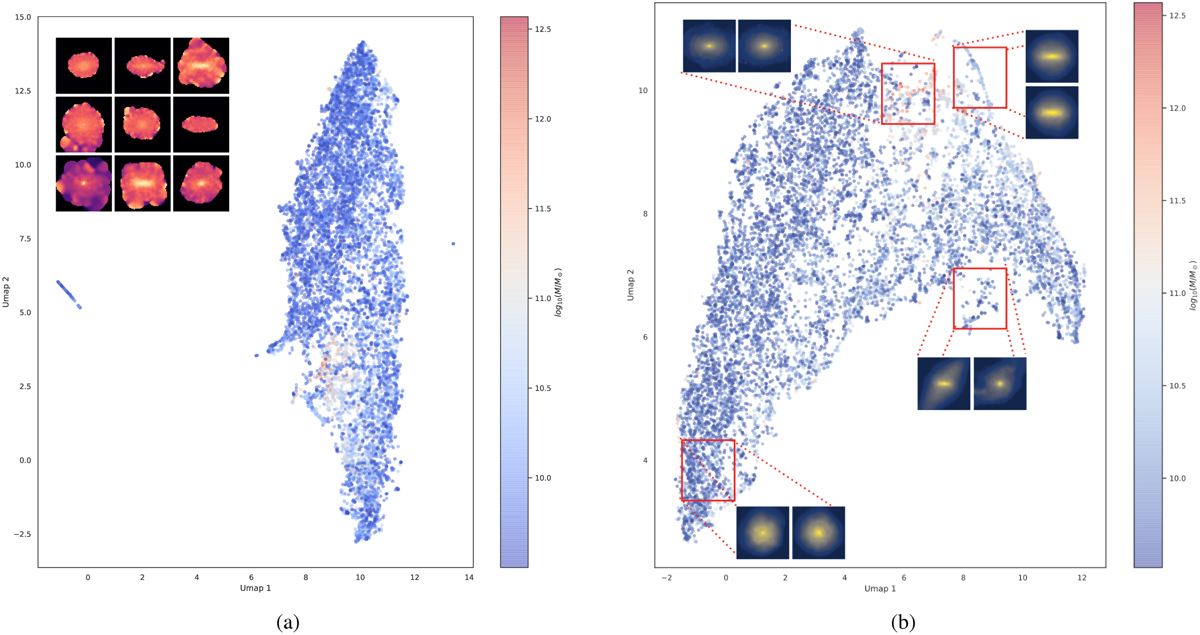
Outlier detection: UMAP projection with n_components=2, n_neighbors=5, min_dist=0.001 calculated (a) on the PCA components of the 2D images to find outliers (b) after filtering outlier galaxy images by choosing galaxies with UMAP1 < 2. We show some of the outliers at the top left of (a). The colour map corresponds to the masses of the galaxies in log10(M/M⊙). An interactive version of the plot on the right can be accessed using an online dashboard referenced in the GitHub repository of this work (see Appendix D)
Current usage metrics show cumulative count of Article Views (full-text article views including HTML views, PDF and ePub downloads, according to the available data) and Abstracts Views on Vision4Press platform.
Data correspond to usage on the plateform after 2015. The current usage metrics is available 48-96 hours after online publication and is updated daily on week days.
Initial download of the metrics may take a while.