Fig. 1
Download original image
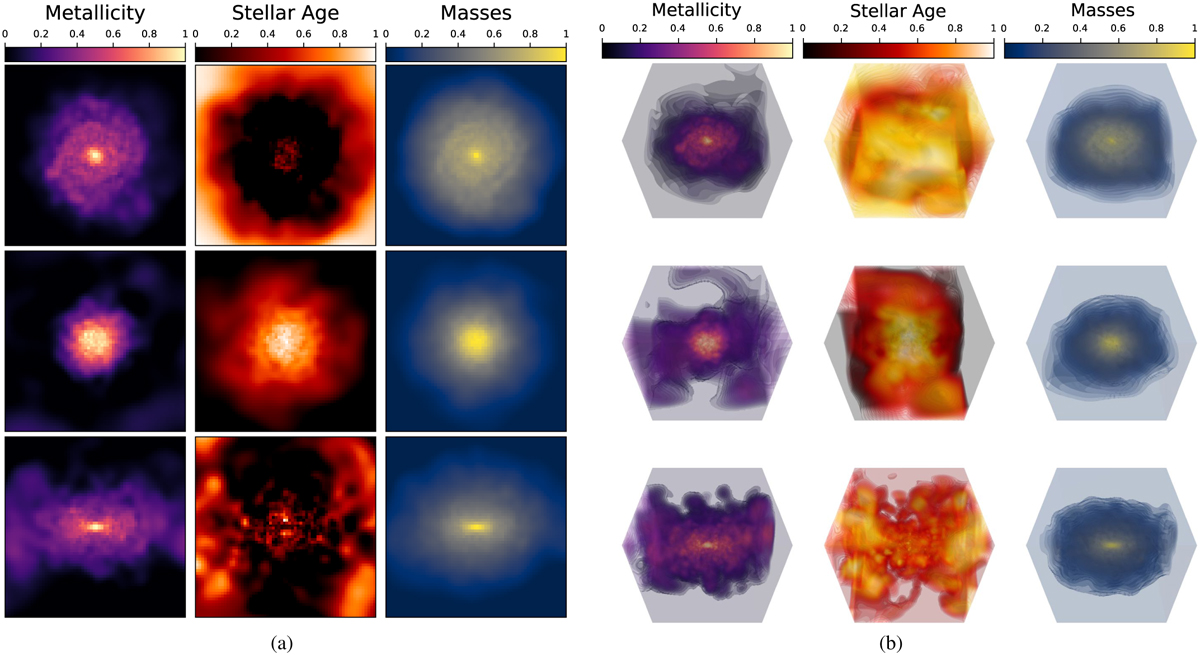
Galaxy images (upper panels) and image cubes (lower panels) in our dataset after the preprocessing steps as explained in Section 2.2. Each row contains one sample galaxy in three stellar maps – metallicity, age and mass from left to right in (a) 2D and (b) 3D. The images are normalised in the range [0,1] and bright pixels correspond to high values. Note that in the stellar age maps, dark pixels correspond to young stars. The three dimensional plots have been created using the plotly python package.
Current usage metrics show cumulative count of Article Views (full-text article views including HTML views, PDF and ePub downloads, according to the available data) and Abstracts Views on Vision4Press platform.
Data correspond to usage on the plateform after 2015. The current usage metrics is available 48-96 hours after online publication and is updated daily on week days.
Initial download of the metrics may take a while.