Fig. 5
Download original image
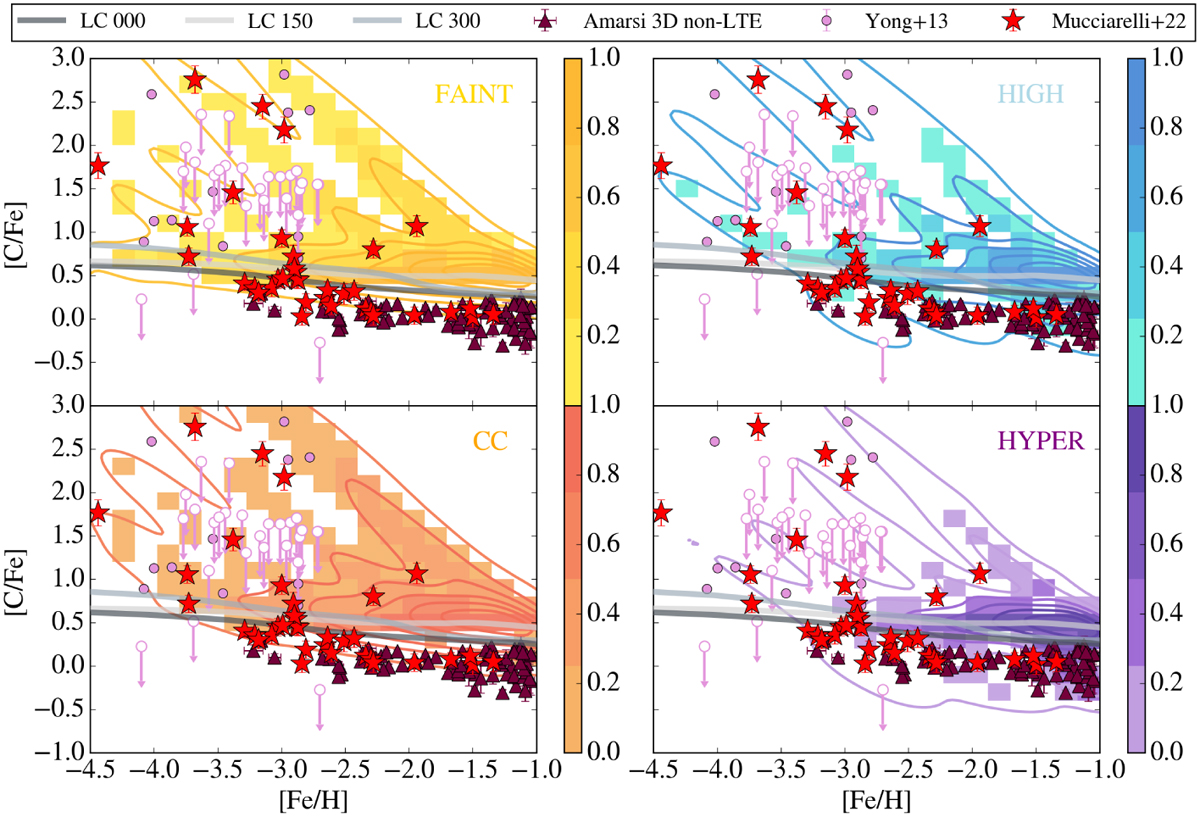
Predicted density maps of [C/Fe] versus [Fe/H] for stellar populations inhabiting the MW halo. The different panels and colors highlight the contributions of various Pop III SN types: faint, core-collapse, high-energy, and hypernovae. The gray continuous lines represent the predictions of the homogeneous model without the contribution of Pop III SNe, for different rotation velocities of Pop II massive stars (vrot = 0, 150, and 300 km s−1, Limongi & Chieffi 2018). Data (symbols, see figure legend) are from Mucciarelli et al. (2022), Yong et al. (2013), and Amarsi et al. (2019). Empty symbols represent upper limits.
Current usage metrics show cumulative count of Article Views (full-text article views including HTML views, PDF and ePub downloads, according to the available data) and Abstracts Views on Vision4Press platform.
Data correspond to usage on the plateform after 2015. The current usage metrics is available 48-96 hours after online publication and is updated daily on week days.
Initial download of the metrics may take a while.