Fig. 4
Download original image
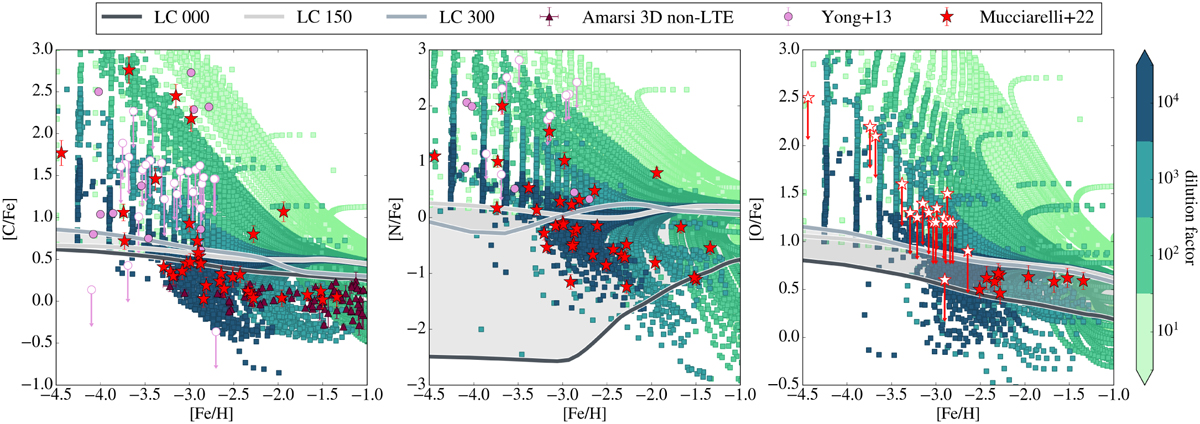
[C/Fe] (left), [N/Fe] (middle), and [O/Fe] (right) versus [Fe/H] abundances predicted by our stochastic chemical evolution model for the Galactic halo (squares). Different shades of green represent different dilution factors (see text and Nandal et al. 2024a,b). Red stars, purple circles, and brown triangles respectively represent the data sets of Mucciarelli et al. (2022), Yong et al. (2013), and Amarsi et al. (2019). Empty symbols represent upper limits. The continuous curves in shades of gray represent the predictions of the homogeneous GCE model without pre-enrichment from Pop III stars, assuming the yield sets of Limongi & Chieffi (2018) with different rotation velocities for massive stars.
Current usage metrics show cumulative count of Article Views (full-text article views including HTML views, PDF and ePub downloads, according to the available data) and Abstracts Views on Vision4Press platform.
Data correspond to usage on the plateform after 2015. The current usage metrics is available 48-96 hours after online publication and is updated daily on week days.
Initial download of the metrics may take a while.