Fig. 2
Download original image
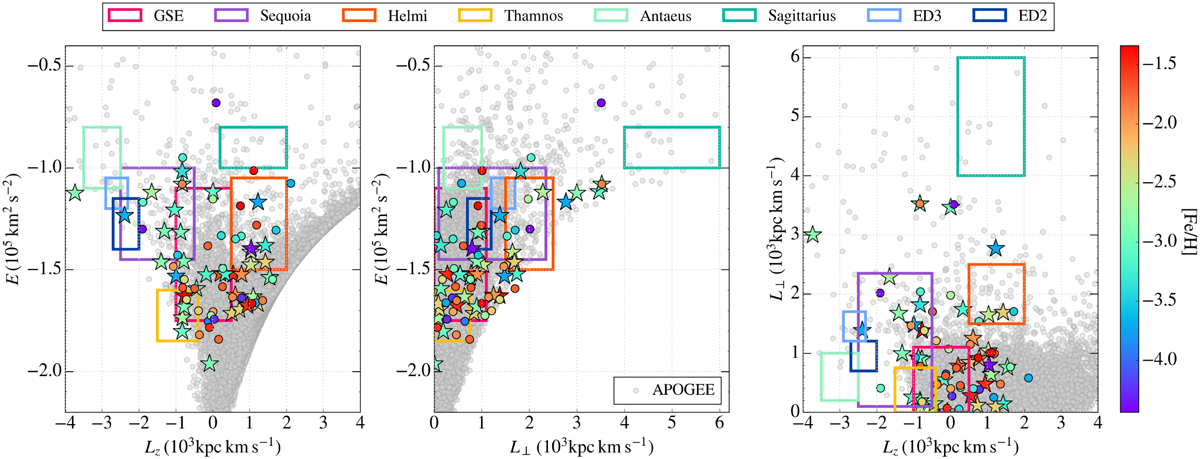
Distribution of the sample stars color coded according to their [Fe/H] abundances in the IoM spaces. The circles are stars from Yong et al. (2013), and star symbols are stars from Mucciarelli et al. (2022). The APOGEE sample is plotted with filled gray points for reference. The boxes represent the positions occupied by previously identified substructures in the Galactic halo (Dodd et al. 2023).
Current usage metrics show cumulative count of Article Views (full-text article views including HTML views, PDF and ePub downloads, according to the available data) and Abstracts Views on Vision4Press platform.
Data correspond to usage on the plateform after 2015. The current usage metrics is available 48-96 hours after online publication and is updated daily on week days.
Initial download of the metrics may take a while.