Fig. 12
Download original image
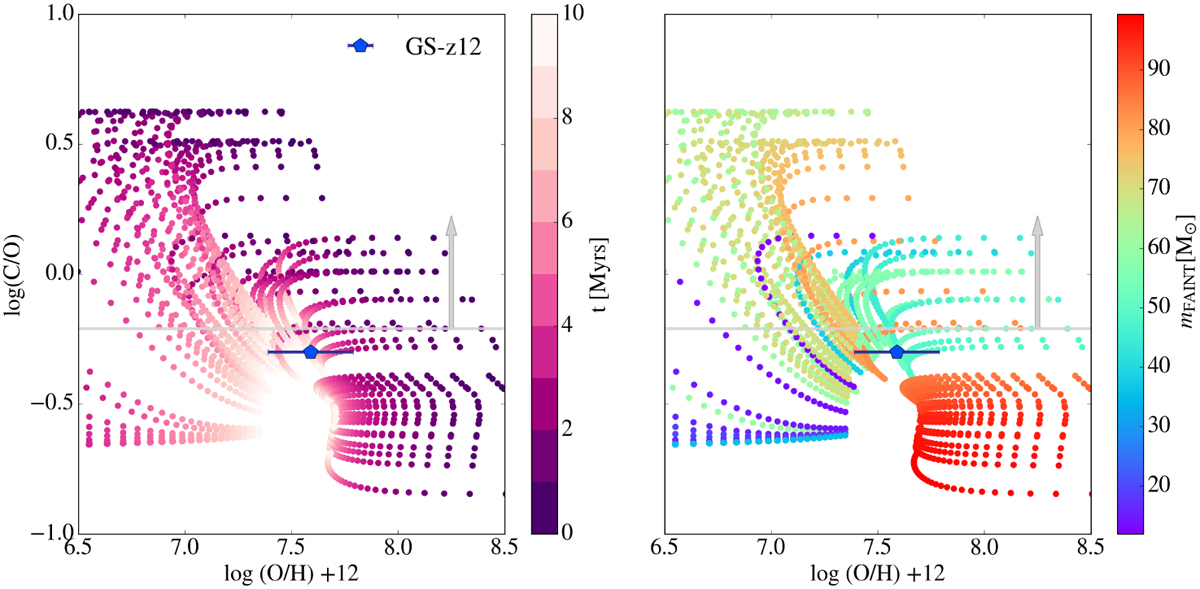
Predicted log(C/O) versus log(O/H) + 12 for GS-z12. The evolutionary tracks represent different PopIII star-forming clumps that merge into the main branch of the galaxy. The tracks are color coded to indicate the time elapsed since the beginning of star formation (left panel) and the PopIII stellar mass (right panel). Also shown is the measured log(C/O) abundance for GS-z12 as derived by D’Eugenio et al. (2024). The blue marker represents the estimate obtained through a Bayesian modeling of the spectrum, while the gray stripe marks the lower limit derived using the photoionization models of Gutkin et al. (2016).
Current usage metrics show cumulative count of Article Views (full-text article views including HTML views, PDF and ePub downloads, according to the available data) and Abstracts Views on Vision4Press platform.
Data correspond to usage on the plateform after 2015. The current usage metrics is available 48-96 hours after online publication and is updated daily on week days.
Initial download of the metrics may take a while.