Fig. 11
Download original image
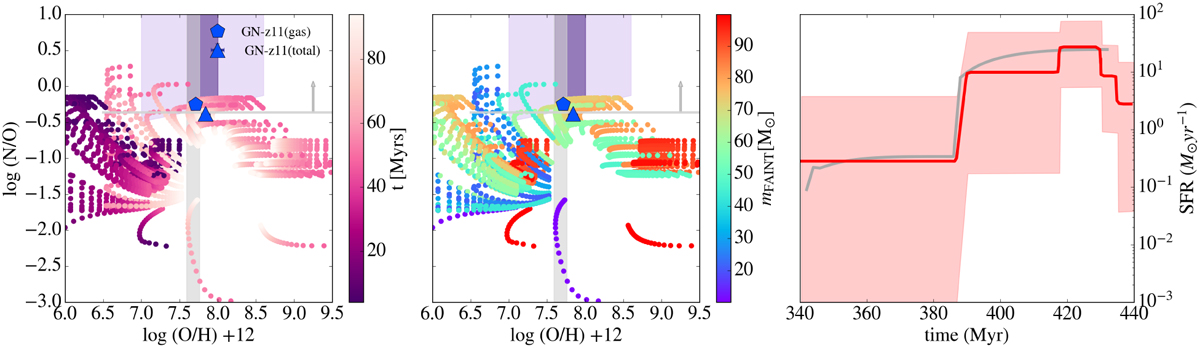
Chemical enrichment of GN-z11. Left and middle panels: predicted log(N/O) versus log(O/H)+12 for GN-z11. Different evolutionary tracks represent different Pop III star-forming clumps, which merge into the main branch of the galaxy. The tracks are color coded according to time elapsed since the beginning of star formation (left) and stellar mass (middle). The light purple trapezoid, the dark purple rectangle, and the gray stripe represent the conservative and fiducial results for the abundances of GN-z11 by Cameron et al. (2023). The blue points are the photoionization modeling results for GN-z11 by Senchyna et al. (2024). Right panel: star formation history of GN-z11 according to Tacchella et al. (2023, red line and shaded area) and as adopted in the model (gray line).
Current usage metrics show cumulative count of Article Views (full-text article views including HTML views, PDF and ePub downloads, according to the available data) and Abstracts Views on Vision4Press platform.
Data correspond to usage on the plateform after 2015. The current usage metrics is available 48-96 hours after online publication and is updated daily on week days.
Initial download of the metrics may take a while.