Fig. 10
Download original image
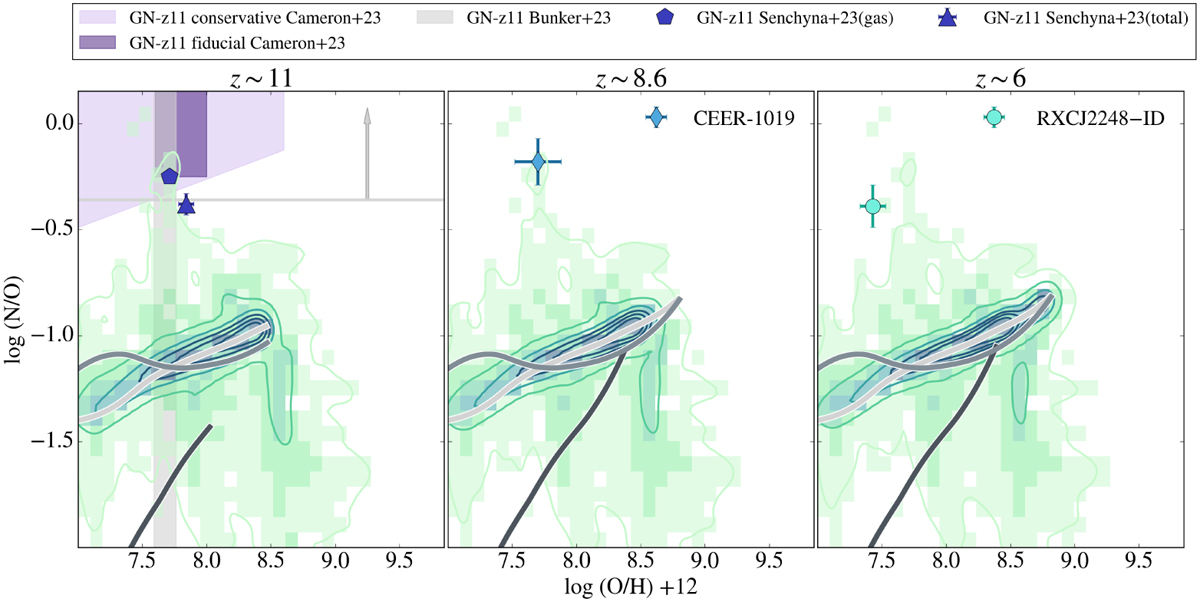
Theoretical log(N/O) versus log(O/H)+12 for a proto-MW galaxy seen at different redshifts. Density maps and contours refer to the predictions of the stochastic GCE model, while the solid lines refer to the predictions of the homogeneous GCE model. Abundances measured in GN-z11 (z = 11, Bunker et al. 2023; Cameron et al. 2023; Senchyna et al. 2024), CEERS-1019 (z = 8.6, Marques-Chaves et al. 2024), and RXCJ2248-ID (z = 6, Topping et al. 2024) are also shown for comparison (symbols and shaded areas).
Current usage metrics show cumulative count of Article Views (full-text article views including HTML views, PDF and ePub downloads, according to the available data) and Abstracts Views on Vision4Press platform.
Data correspond to usage on the plateform after 2015. The current usage metrics is available 48-96 hours after online publication and is updated daily on week days.
Initial download of the metrics may take a while.