Open Access
Fig. 9
Download original image
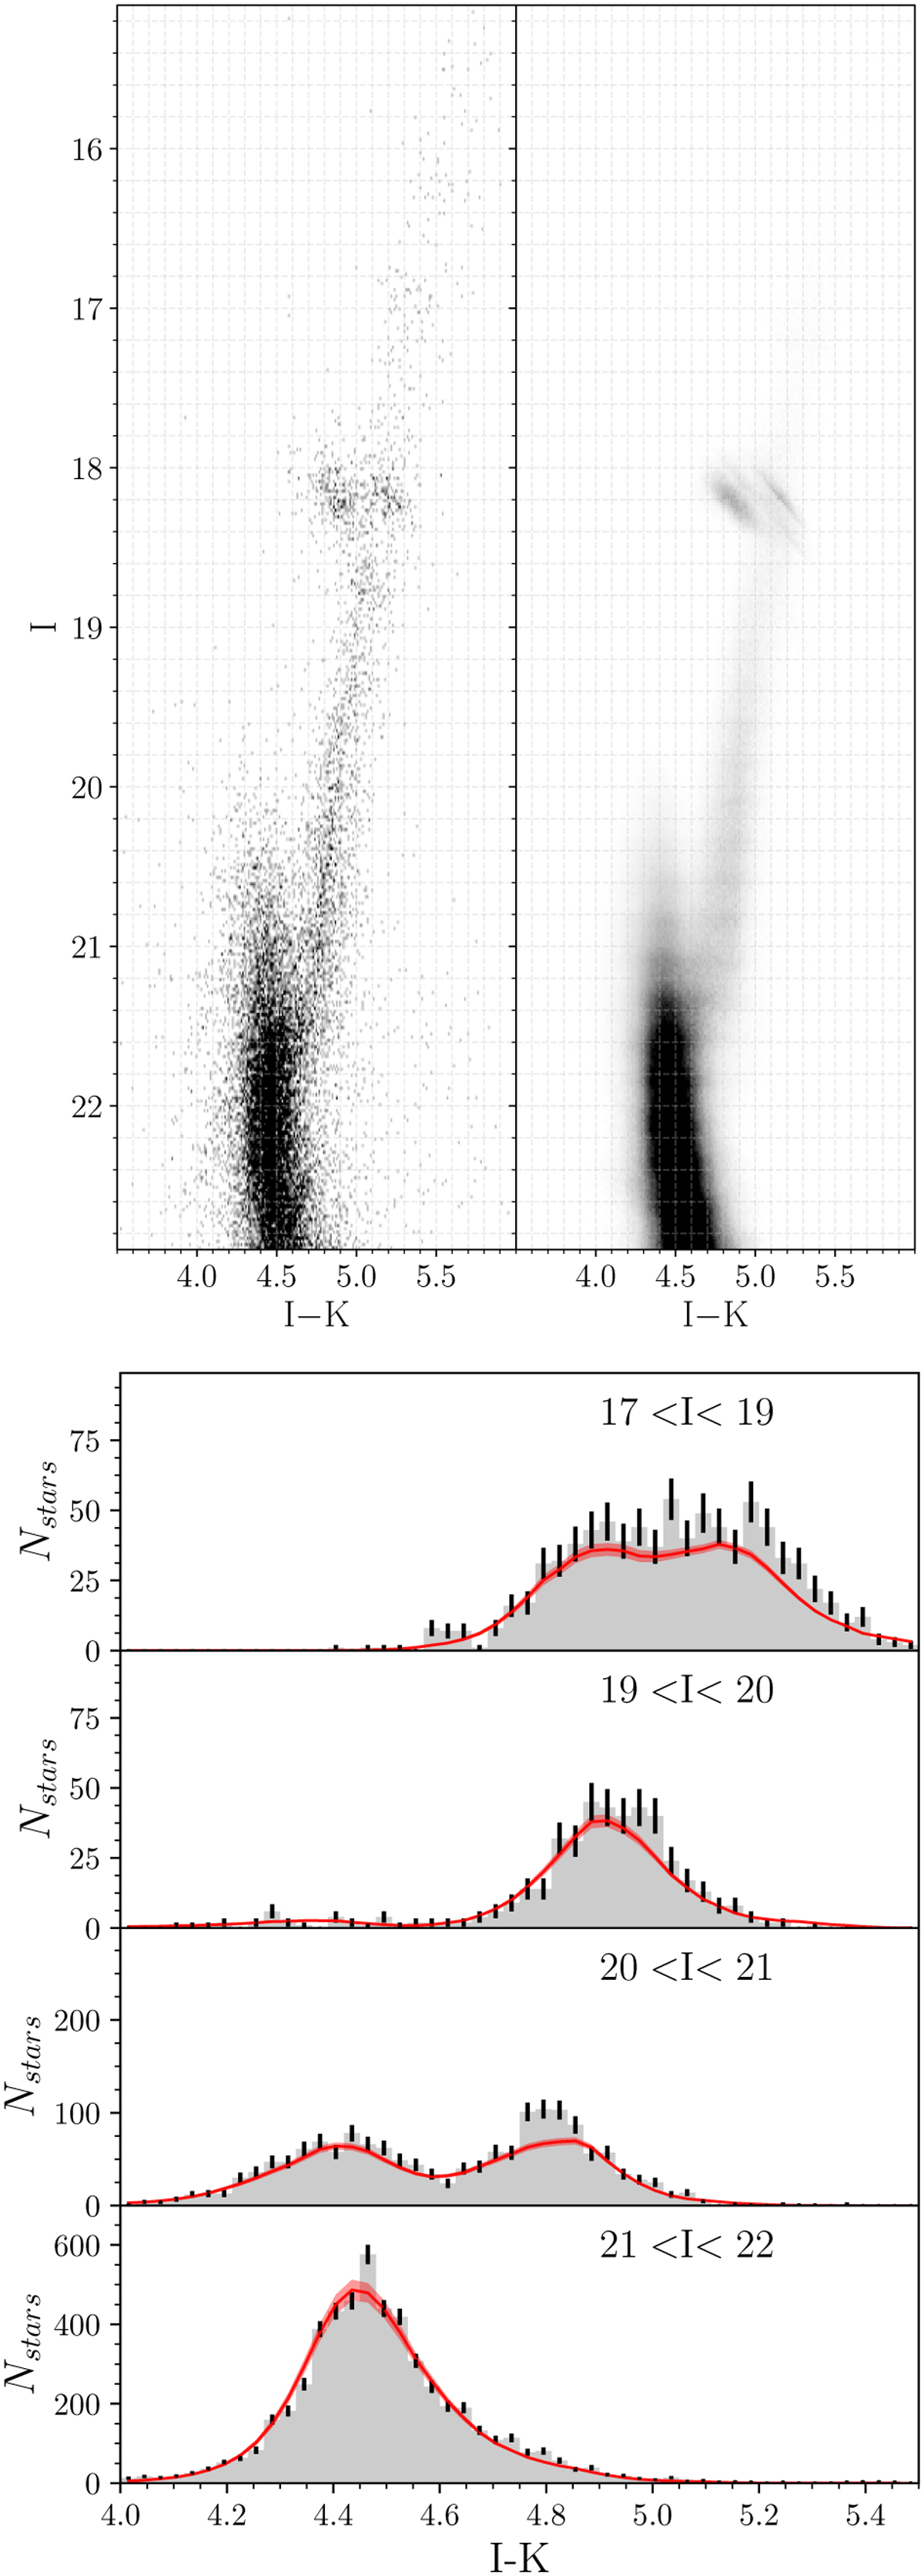
Upper panels: Hess diagrams of the observed DRC (left) and best-fit synthetic (right) CMD. Lower panels: color functions of the CMDs in four different magnitude bins; the data and relative Poissonian uncertainty are displayed in gray, while the models are the superimposed red line.
Current usage metrics show cumulative count of Article Views (full-text article views including HTML views, PDF and ePub downloads, according to the available data) and Abstracts Views on Vision4Press platform.
Data correspond to usage on the plateform after 2015. The current usage metrics is available 48-96 hours after online publication and is updated daily on week days.
Initial download of the metrics may take a while.