Fig. 9
Download original image
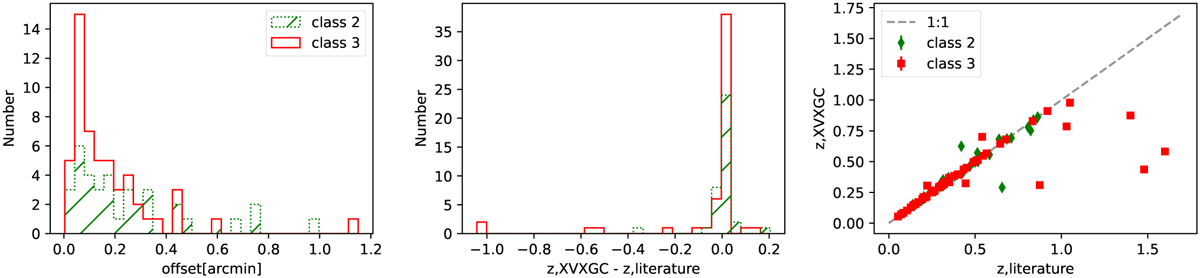
Distribution of position offset and redshift difference for the cross-matched clusters between XVXGC and literature (left and middle panels, respectively). The right panel is the redshift comparison. The “z,literature” in the panels indicates the redshifts from the literature. Red solid histogram and red squares for class 3, green dot histogram, and green diamonds for class 2.
Current usage metrics show cumulative count of Article Views (full-text article views including HTML views, PDF and ePub downloads, according to the available data) and Abstracts Views on Vision4Press platform.
Data correspond to usage on the plateform after 2015. The current usage metrics is available 48-96 hours after online publication and is updated daily on week days.
Initial download of the metrics may take a while.