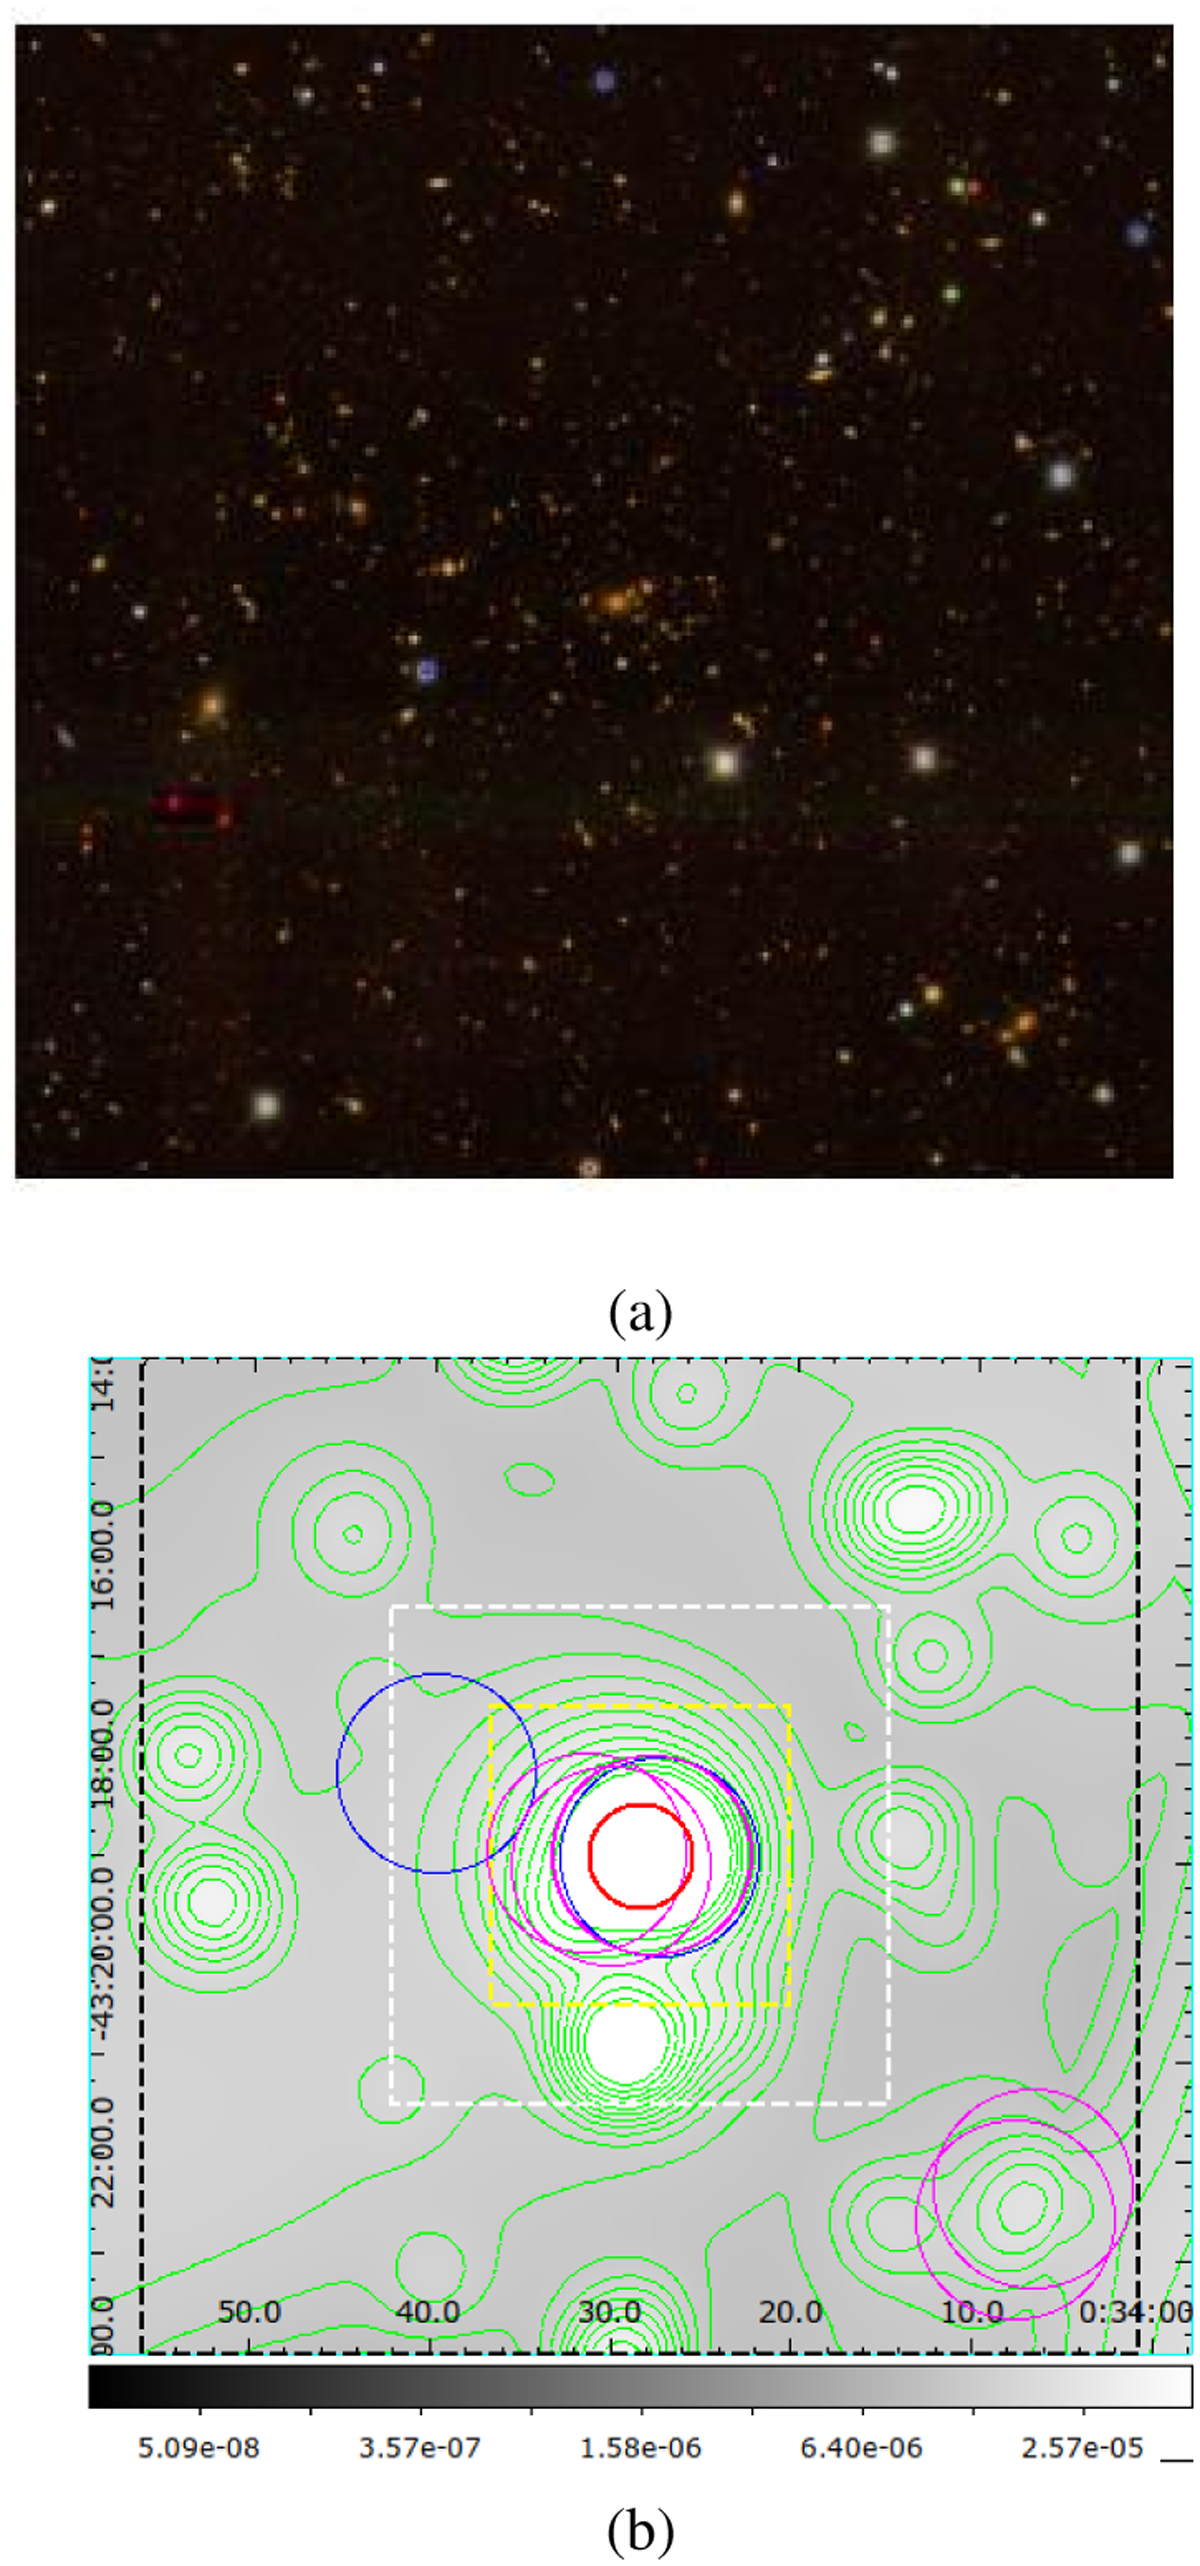
Fig. 6
Download original image
Image of the cluster “es_1” in RGB color and reconstructed X-ray image. Panel a: RGB image combining 𝑔, r, i bands from DES survey, in the size of 10′ × 10′. Panel b: reconstructed X-ray image in log scale, overlaid with X-ray contours in green, and previously identified clusters whose symbols are consistent with Fig. 5a. The size of the white and yellow boxes are the same as Fig. 5a. The size of black box is 10′ × 10′.
Current usage metrics show cumulative count of Article Views (full-text article views including HTML views, PDF and ePub downloads, according to the available data) and Abstracts Views on Vision4Press platform.
Data correspond to usage on the plateform after 2015. The current usage metrics is available 48-96 hours after online publication and is updated daily on week days.
Initial download of the metrics may take a while.