Fig. 5
Download original image
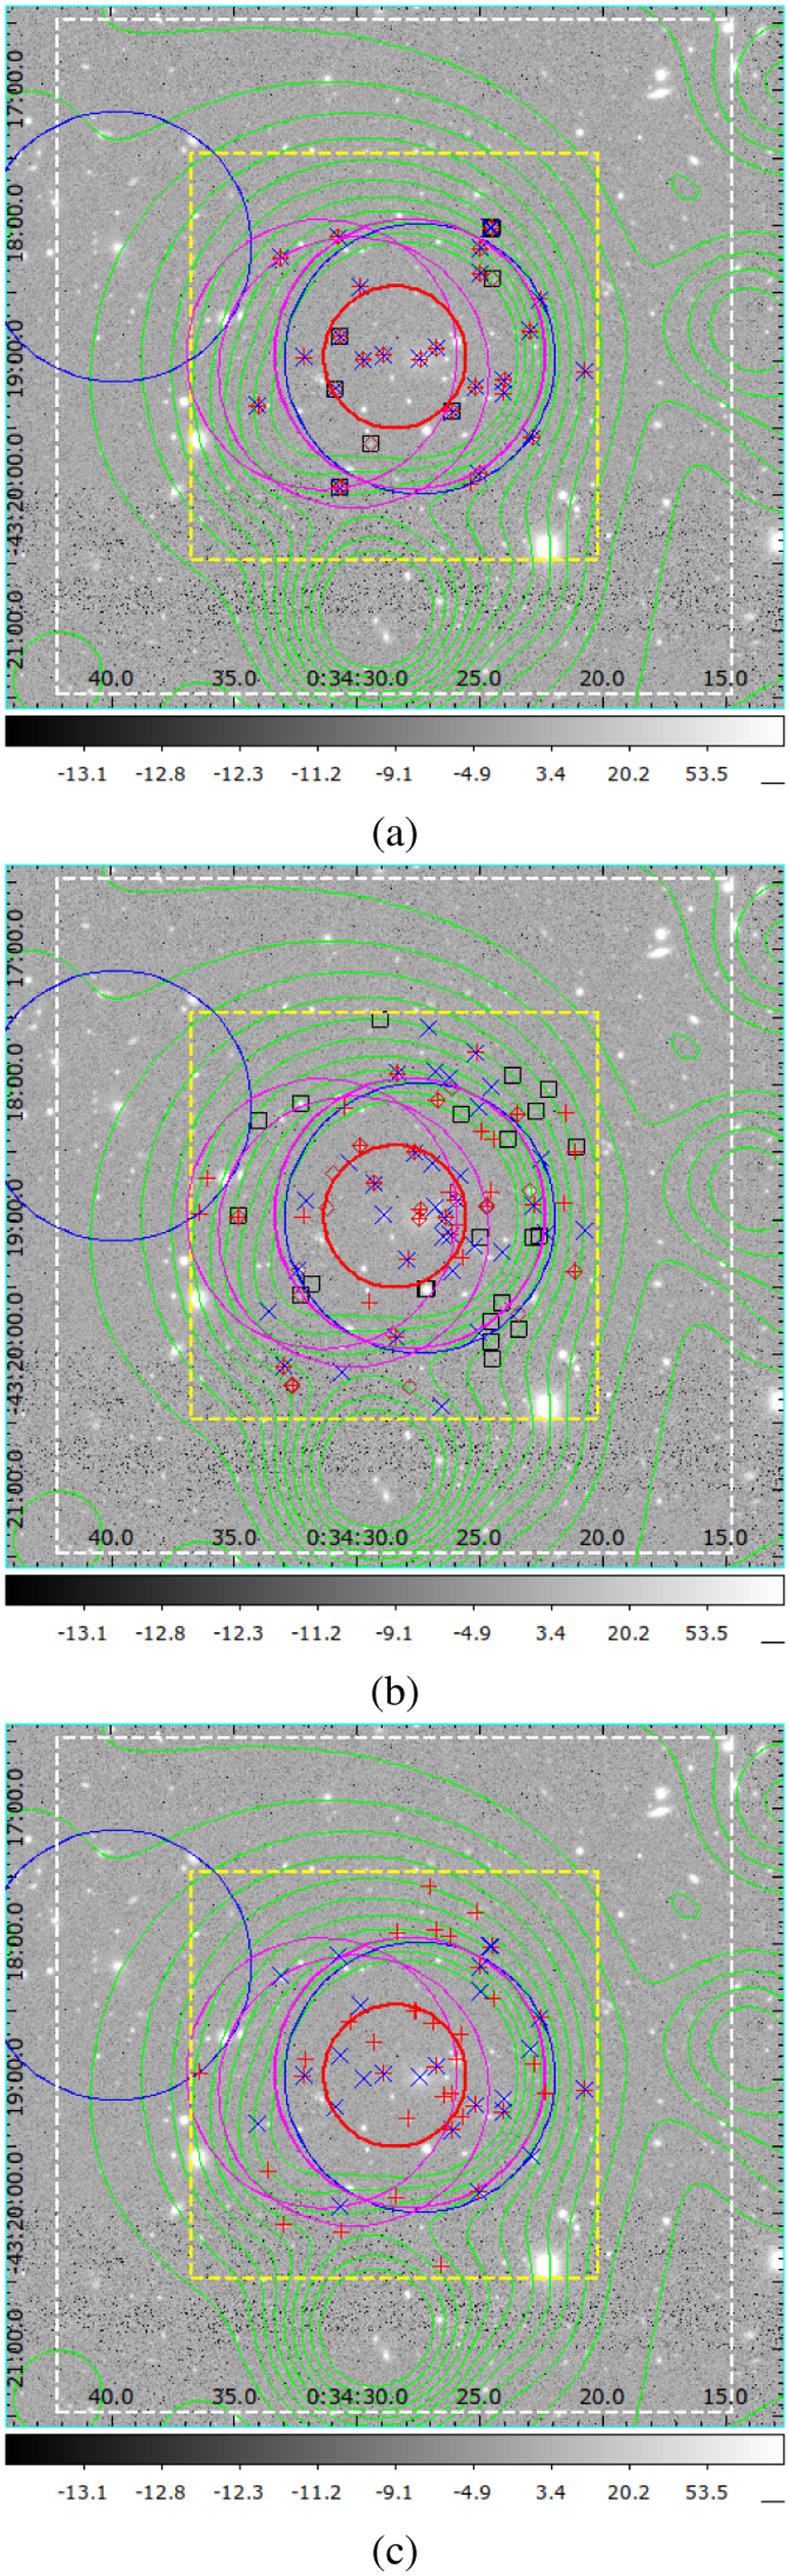
Spatial distribution of galaxies surrounding the cluster “es_1” in a specific redshift layer corresponding to the three panels in Fig. 4, in sequence. Panel a: r-band image in log scale, overlaid with galaxies redshifts within ±0.015 around the four highest redshift bins (blue “x”, red “+”, brown diamond, and black box in sequence) in Fig. 4a, X-ray contour in green, location of previously identified clusters (referring to Sect. 3.5, magenta circle for ICM-detected cluster, blue circle for OPT/IR cluster, radius as the smaller value of 0.5 Mpc and 1.0′), the location of XVXGC cluster (red circle with a radius of “EXTENT” value), and the white box with the size of 5′ × 5′, the yellow box with the size of 3.0′ × 3.0′. Panel b: same as Fig. 5a, but for the photometric redshifts. Panel c: same as Fig. 5a, but overlaid only the location of member galaxies (blue “x” for spectroscopic redshift, red “+” for photometric redshift).
Current usage metrics show cumulative count of Article Views (full-text article views including HTML views, PDF and ePub downloads, according to the available data) and Abstracts Views on Vision4Press platform.
Data correspond to usage on the plateform after 2015. The current usage metrics is available 48-96 hours after online publication and is updated daily on week days.
Initial download of the metrics may take a while.