Fig. 4
Download original image
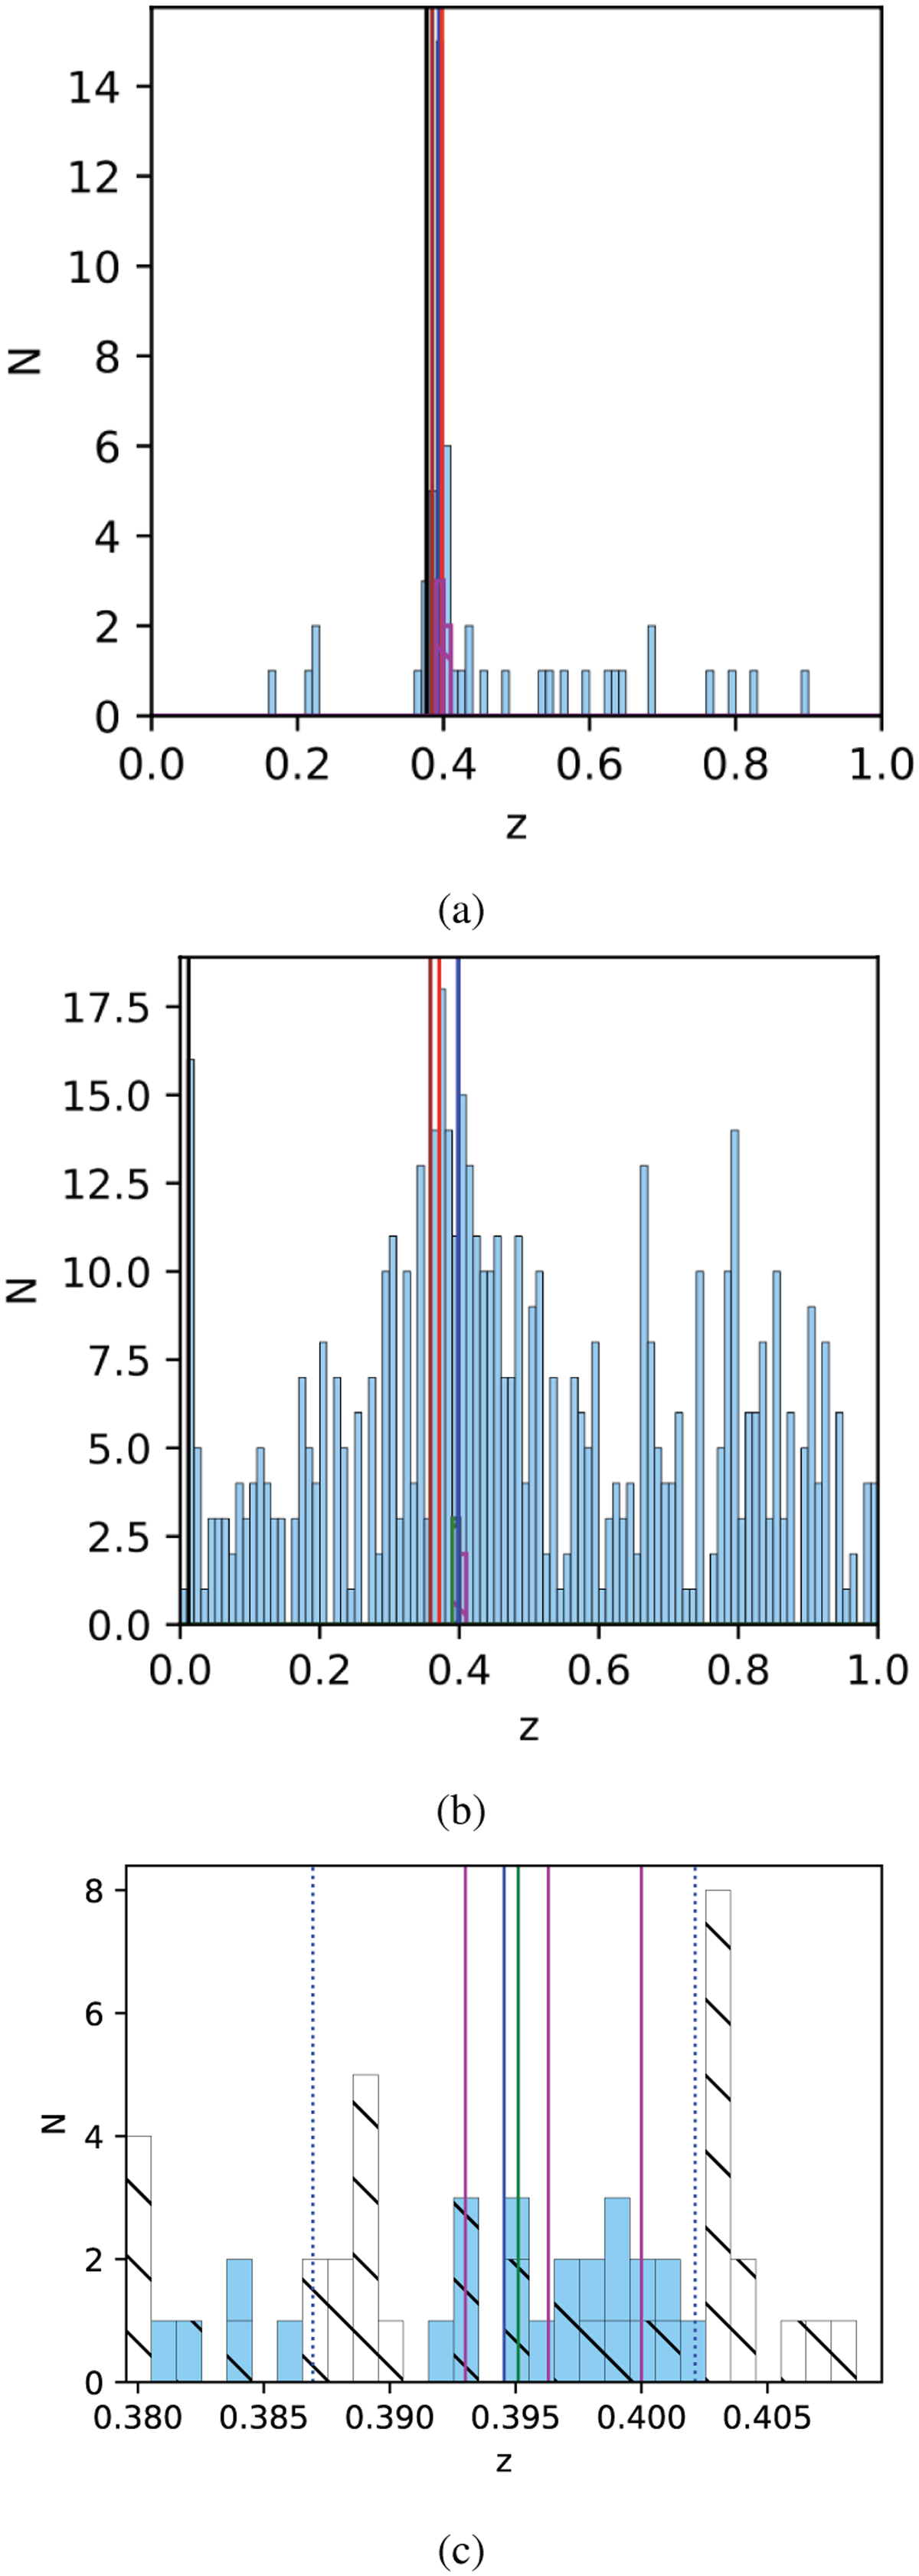
Redshift histogram of galaxies within the offset <1.5′ of the cluster “es_1” for the visual check, as an example. Panel a: spectroscopic redshift within 0-1.0. The bin width is 0.01. The blue, red, brown, and black vertical lines show the location of the four highest bins. The magenta and green histograms are for the redshifts of previous ICM-detected clusters and OPT/IR clusters with offset <3.0′, respectively. Panel b: photometric redshift within 0-1.0. Symbols are the same as in Fig. 4a. Panel c: redshift histogram of member galaxies within zpeak ± 0.015, shown in 30 bins. Blue bins for spectroscopic red-shifts, and black hatched bins for photometric redshifts. The blue solid and blue dotted vertical lines show the cluster redshift and its 1σ range. The magenta and green vertical lines are the redshifts of previous ICM-detected clusters and OPT/IR clusters within 3.0′.
Current usage metrics show cumulative count of Article Views (full-text article views including HTML views, PDF and ePub downloads, according to the available data) and Abstracts Views on Vision4Press platform.
Data correspond to usage on the plateform after 2015. The current usage metrics is available 48-96 hours after online publication and is updated daily on week days.
Initial download of the metrics may take a while.