Open Access
Fig. 2
Download original image
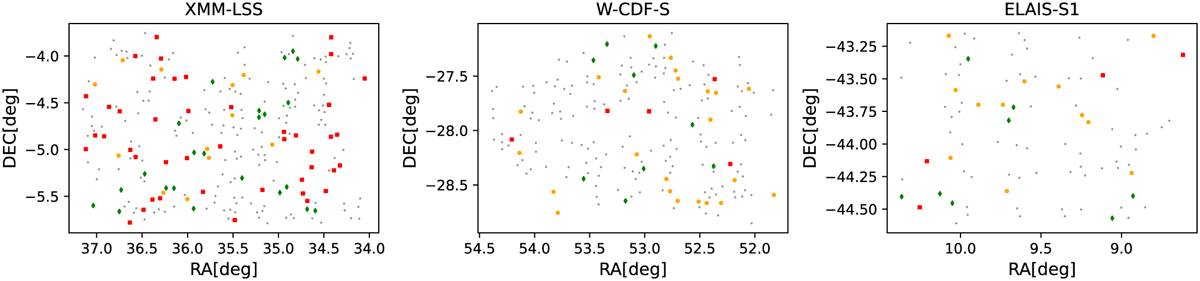
Class 1, 2, and 3 detections, along with the false detections, shown in orange circles, green diamonds, red squares, and grey dots, respectively. The classification of detections is described in Sect. 3.5. The three regions of XMM-SERVS are shown in sequence.
Current usage metrics show cumulative count of Article Views (full-text article views including HTML views, PDF and ePub downloads, according to the available data) and Abstracts Views on Vision4Press platform.
Data correspond to usage on the plateform after 2015. The current usage metrics is available 48-96 hours after online publication and is updated daily on week days.
Initial download of the metrics may take a while.