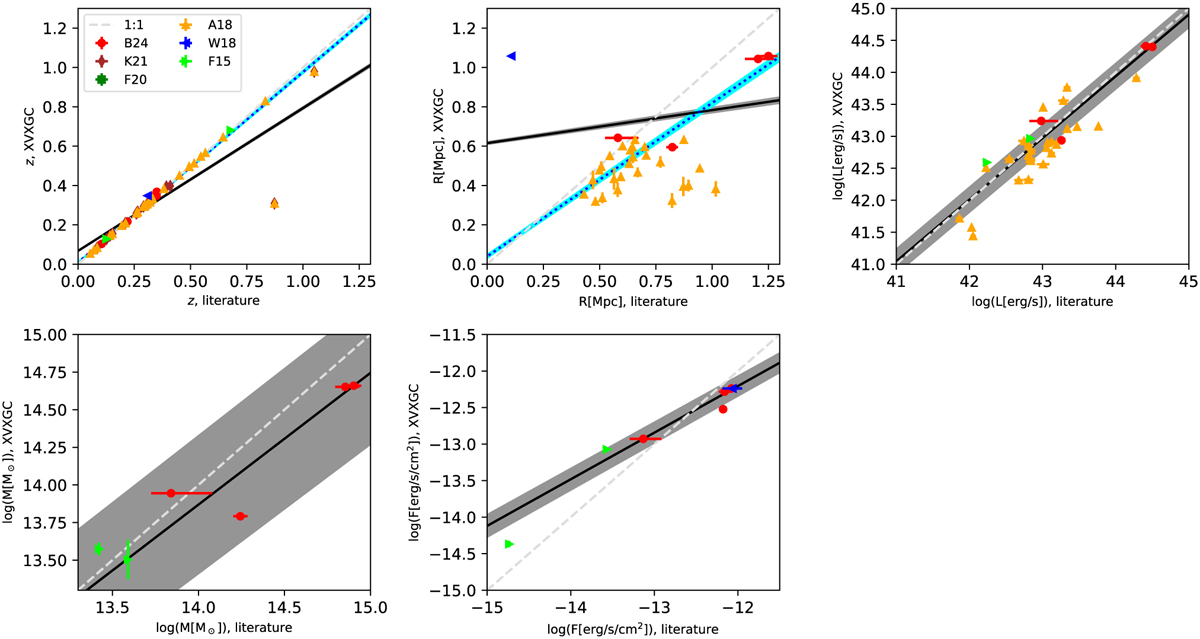
Fig. 14
Download original image
Comparison of physical parameters in XVXGC catalog and other X-ray cluster catalogs. The grey dashed lines show a 1:1 relation. The best-fitting linear function is shown in a black line, with the 1σ error shown in the grey region. The parameter values of the best-fitting linear model and K-S test parameters are shown in Table 4. In the first panel, after removing two outliers at the lower-right part, a second best-fitting model is overlaid as the blue dotted line together with the cyan shade for its 1σ error. In the second panel, the second best-fitting model is also overlaid when the outlier at the upper-left part is removed.
Current usage metrics show cumulative count of Article Views (full-text article views including HTML views, PDF and ePub downloads, according to the available data) and Abstracts Views on Vision4Press platform.
Data correspond to usage on the plateform after 2015. The current usage metrics is available 48-96 hours after online publication and is updated daily on week days.
Initial download of the metrics may take a while.