Fig. 11
Download original image
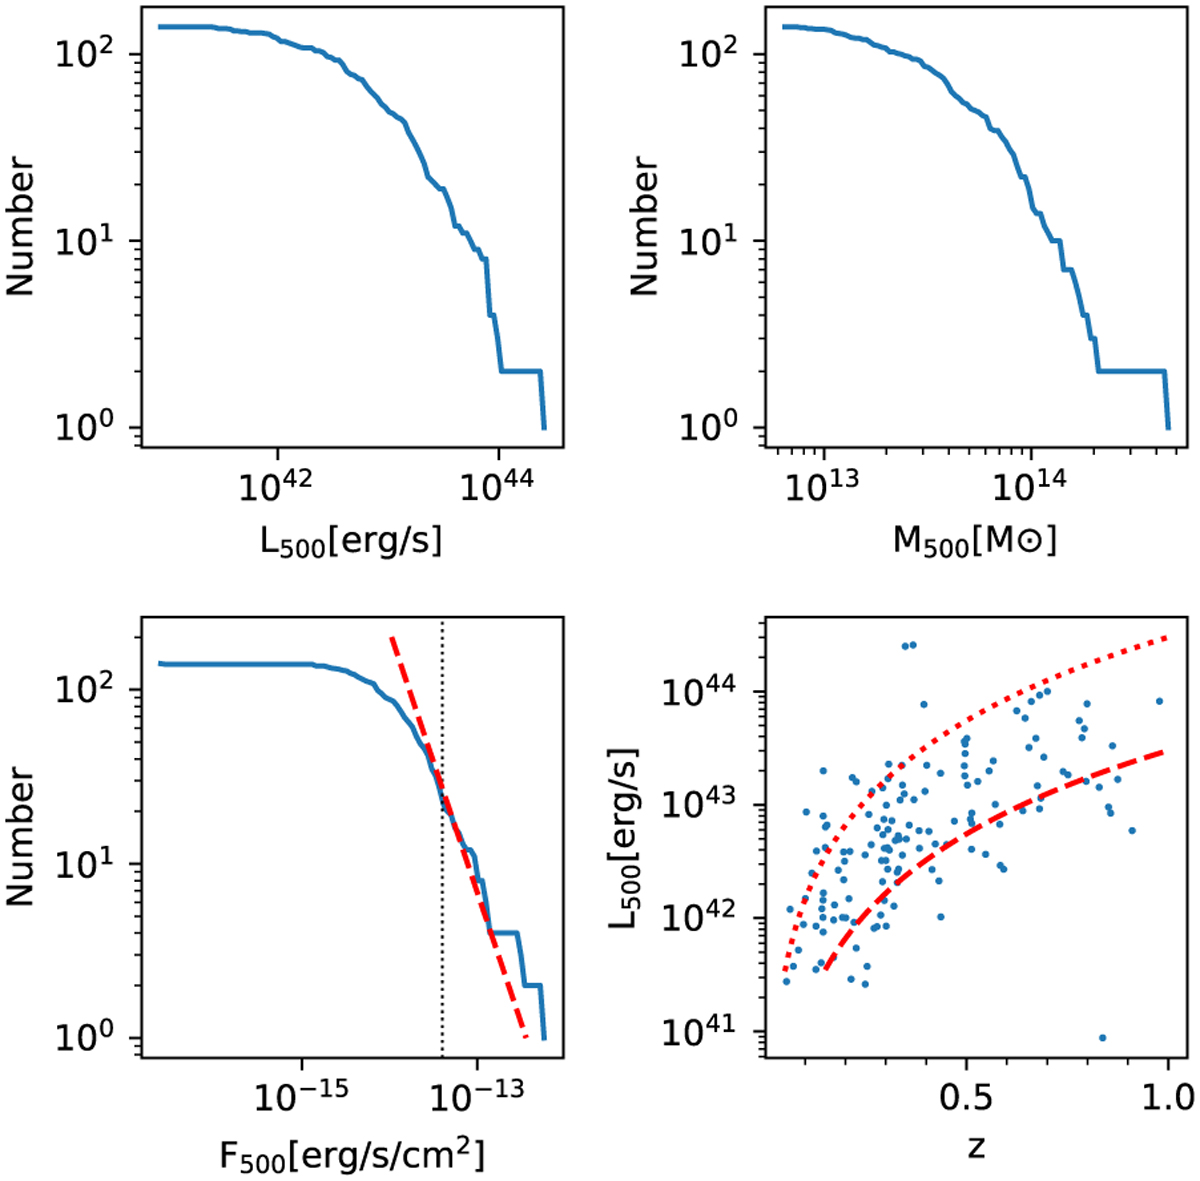
Cumulative number of luminosity, mass, and flux, as well as the relation between luminosity and redshift. In the lower-left panel, the dashed line indicates the line with the slope of –1.5 and normalized at F500 = 4 × 10–14 erg/s/cm2. In the lower-right panel, the dashed and dotted curve corresponds to the F500 of 4 × 10–15 erg/s/cm2, and 4 × 10–14 erg/s/cm2, respectively.
Current usage metrics show cumulative count of Article Views (full-text article views including HTML views, PDF and ePub downloads, according to the available data) and Abstracts Views on Vision4Press platform.
Data correspond to usage on the plateform after 2015. The current usage metrics is available 48-96 hours after online publication and is updated daily on week days.
Initial download of the metrics may take a while.