Fig. 1
Download original image
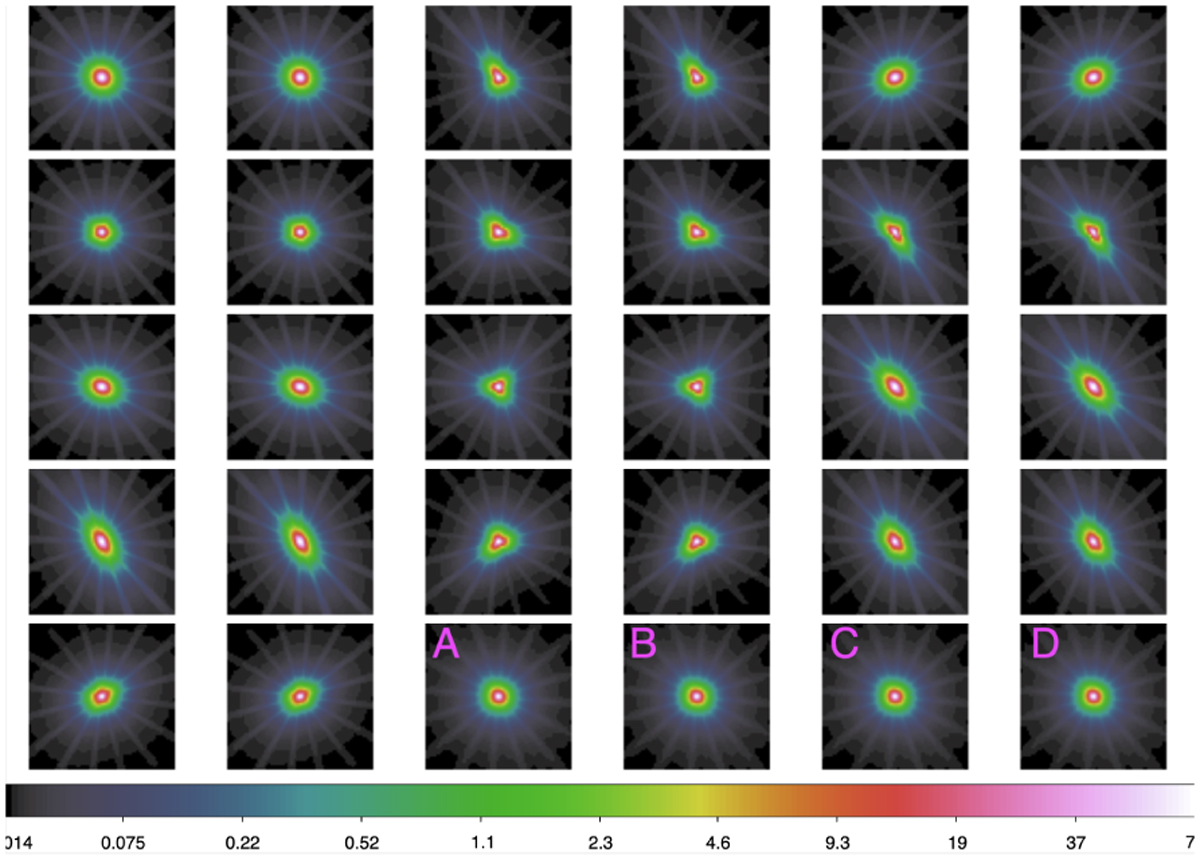
Example of PSF reconstruction of one object, shown in logarithm scale. Panels show the PSF of each observation in the energy of 1 keV and 2 keV, except for the last four panels (panels A, B, C, and D). Panels A and B are the combined PSF weighted with exposure map in 1 keV and 2 keV, separately. In panel C, the PSF image in 1 keV and the PSF image in 2 keV are combined. Panel D shows the combined PSF image multiplied by the source count, as the final PSF image.
Current usage metrics show cumulative count of Article Views (full-text article views including HTML views, PDF and ePub downloads, according to the available data) and Abstracts Views on Vision4Press platform.
Data correspond to usage on the plateform after 2015. The current usage metrics is available 48-96 hours after online publication and is updated daily on week days.
Initial download of the metrics may take a while.