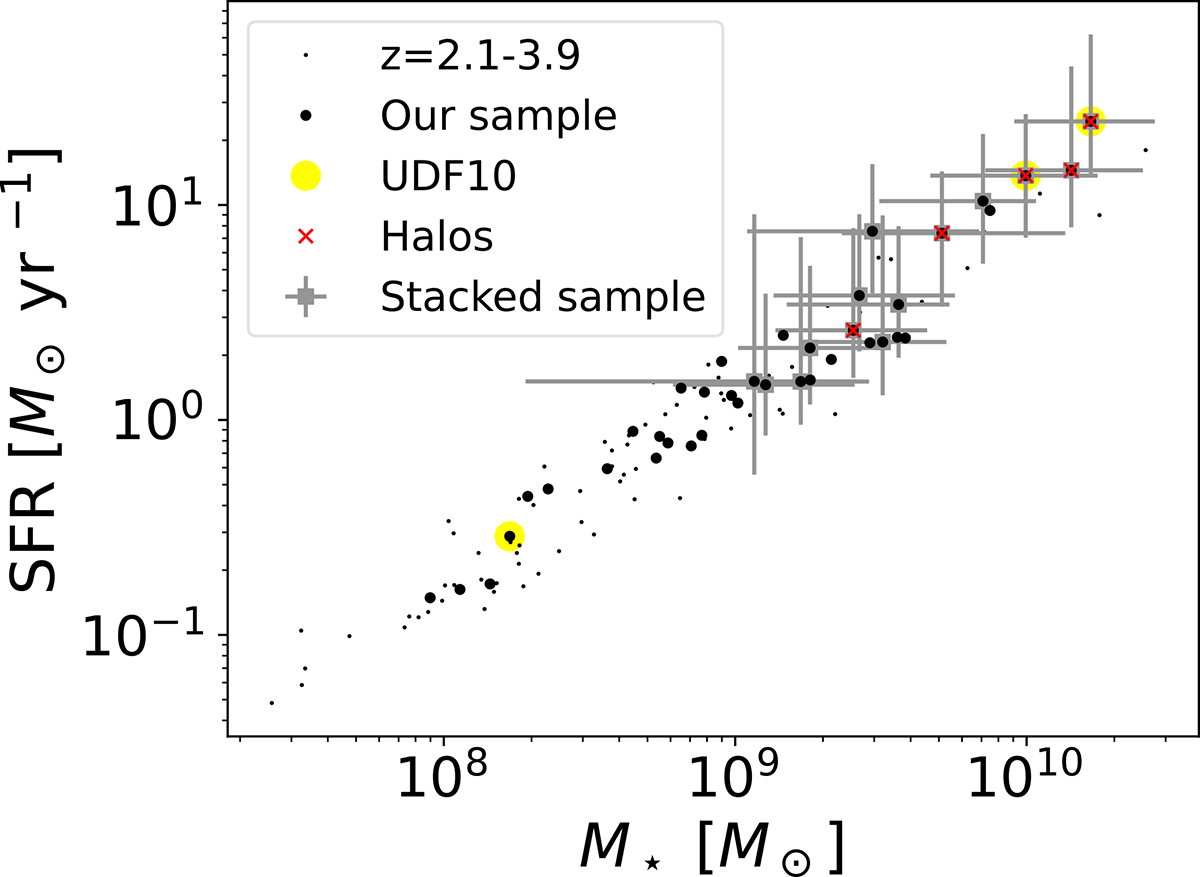
Fig. A.1.
Download original image
SFR and M⋆ for the full sample (black circles), the stacked sample (gray squares with error bars), the three sources in udf-10 (yellow circles), and the individual Si II* halos (red crosses), compared to those of galaxies z = 2.1–3.9 in the DR2 catalog (gray dots). Due to the large 1σ uncertainties in SFR and M⋆ (Bacon et al. 2023), error bars are shown only for the stacked sample" for clarity and conciseness. The full sample lies along the relation for the galaxies at z = 2.1–3.9 in the same catalog, which suggests that our sample is not biased toward starburst galaxies.
Current usage metrics show cumulative count of Article Views (full-text article views including HTML views, PDF and ePub downloads, according to the available data) and Abstracts Views on Vision4Press platform.
Data correspond to usage on the plateform after 2015. The current usage metrics is available 48-96 hours after online publication and is updated daily on week days.
Initial download of the metrics may take a while.