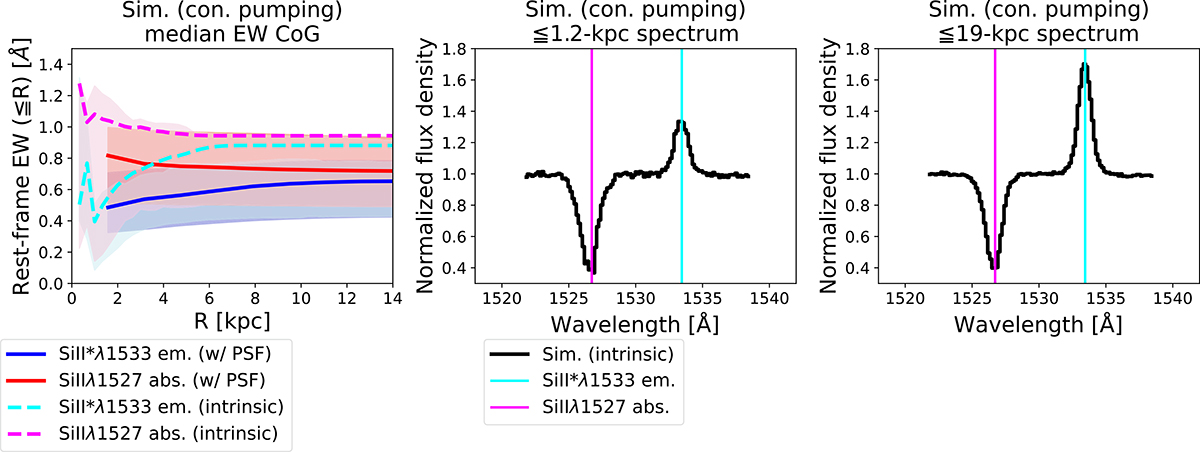
Fig. 8.
Download original image
EW CoG and spectra of the simulations with continuum pumping. Left: Median cumulative EW in rest-frame as a function or R. The blue and red solid lines (shades) indicate the EW of Si II* λ1533 emission and Si IIλ1527 absorption lines (their 1σ uncertainties) with MUSE PSF convolution, respectively. The cyan and magenta dashed lines (shades) show the intrinsic EW of Si II* λ1533 emission and the Si IIλ1527 absorption lines (their 1σ uncertainties). Middle: Median spectrum extracted from the intrinsic mock cube with a 1.2 kpc aperture (galaxy scale) shown by the black line. The cyan and magenta lines show the wavelength of Si II* λ1533 emission and Si IIλ1527 absorption lines, respectively. Right: Median spectrum extracted from the intrinsic mock cube with a 19 kpc aperture (CGM scale). The EWs of the Si II* λ1533 emission and Si IIλ1527 absorption are consistent on a CGM scale for both intrinsic cubes and PSF-convolved cubes, which are also seen on the mock spectra.
Current usage metrics show cumulative count of Article Views (full-text article views including HTML views, PDF and ePub downloads, according to the available data) and Abstracts Views on Vision4Press platform.
Data correspond to usage on the plateform after 2015. The current usage metrics is available 48-96 hours after online publication and is updated daily on week days.
Initial download of the metrics may take a while.