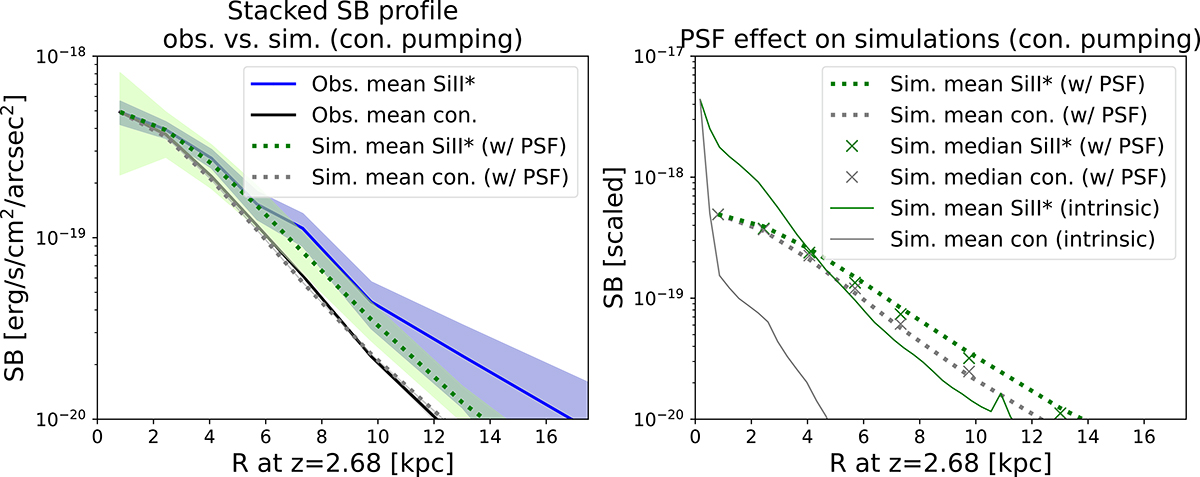
Fig. 7.
Download original image
Stacked SB profiles of our observations and of zoom-in simulations from Mauerhofer et al. (2021). Left: Comparison of stacked SB profiles. The blue and black solid lines show the observed mean-stacked SB profiles of Si II* λ1533 and the continuum, respectively. The blue shade indicates 1σ uncertainties for Si II* λ1533. The observed continuum is normalized at R = 0 to the peak of the observed Si II* λ1533. The green and gray dotted lines (shades) show the mean-stacked SB profiles of Si II* λ1533 and the continuum, respectively, for the simulations after PSF and LSF convolution (their 1σ uncertainties, which correspond to the 15.87 to 84.13 percentiles of SB profiles for individual mocks). They are normalized at R = 0 to the peak of the observed Si II* profile. Right: Stacked SB profiles for simulations. The green and gray dotted (solid) lines show the mean-stacked SB profiles of Si II* λ1533 and continuum, respectively, with (without) PSF and LSF convolution. The green and gray crosses show the median-stacked SB profiles of Si II* λ1533 and the continuum, respectively, with PSF and LSF convolution. They are scaled by the same factor as used in the left panel. The left panel shows that the observed stacked SB profiles can be reproduced within the 1σ uncertainties by the simulations, which account for continuum pumping.
Current usage metrics show cumulative count of Article Views (full-text article views including HTML views, PDF and ePub downloads, according to the available data) and Abstracts Views on Vision4Press platform.
Data correspond to usage on the plateform after 2015. The current usage metrics is available 48-96 hours after online publication and is updated daily on week days.
Initial download of the metrics may take a while.