Fig. 5.
Download original image
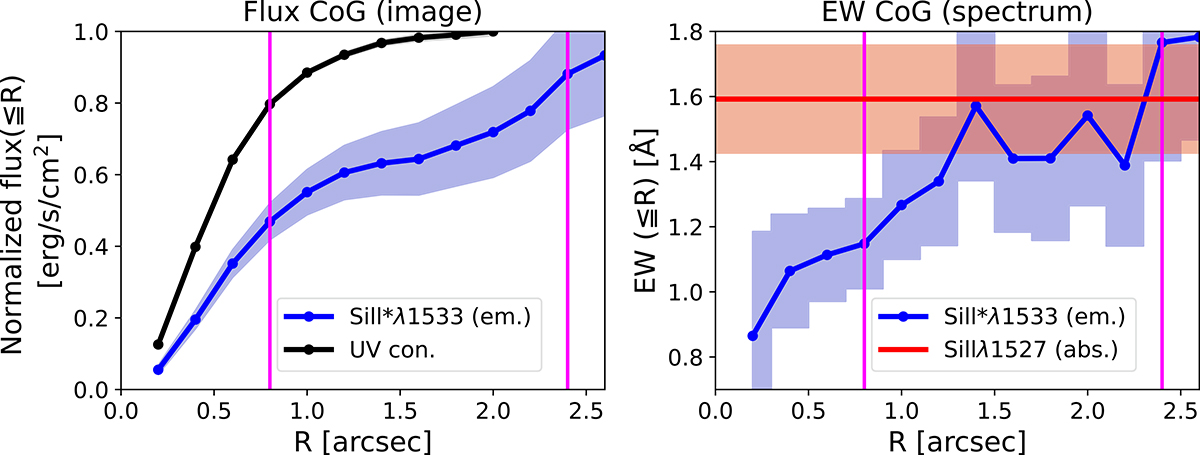
Curve of growth (CoG) for Si II* flux and EW for MID = 1141. Left: Normalized fluxes within radius R as a function of R measured from the Si II* NB image (blue line) and the UV continuum BB image (black line). The blue shade indicates 1σ uncertainties for the Si II* flux. The vertical magenta lines show R = ![]() (galaxy scale) and R =
(galaxy scale) and R = ![]() (CGM scale). Right: EW(Si II*) CoG as a function of R shown by the blue line with the blue shade indicating 1σ uncertainties. The EWs are measured in spectra extracted from the original minicube with growing apertures around the HST center. The red line and shade show the EW for Si II absorption at R =
(CGM scale). Right: EW(Si II*) CoG as a function of R shown by the blue line with the blue shade indicating 1σ uncertainties. The EWs are measured in spectra extracted from the original minicube with growing apertures around the HST center. The red line and shade show the EW for Si II absorption at R = ![]() and its 1σ uncertainty, respectively. The left panel shows that the galaxy-scale aperture includes about 80% of the continuum, but only 50% of the Si II*, while the CGM-scale aperture captures most of the Si II* flux. The right panel shows that the absorption EW on the galaxy scale and the fluorescent emission EW on the CGM scale are consistent with each other (photon conserved), which implies that the origin of extended Si II* emission is the continuum pumping.
and its 1σ uncertainty, respectively. The left panel shows that the galaxy-scale aperture includes about 80% of the continuum, but only 50% of the Si II*, while the CGM-scale aperture captures most of the Si II* flux. The right panel shows that the absorption EW on the galaxy scale and the fluorescent emission EW on the CGM scale are consistent with each other (photon conserved), which implies that the origin of extended Si II* emission is the continuum pumping.
Current usage metrics show cumulative count of Article Views (full-text article views including HTML views, PDF and ePub downloads, according to the available data) and Abstracts Views on Vision4Press platform.
Data correspond to usage on the plateform after 2015. The current usage metrics is available 48-96 hours after online publication and is updated daily on week days.
Initial download of the metrics may take a while.