Fig. 4.
Download original image
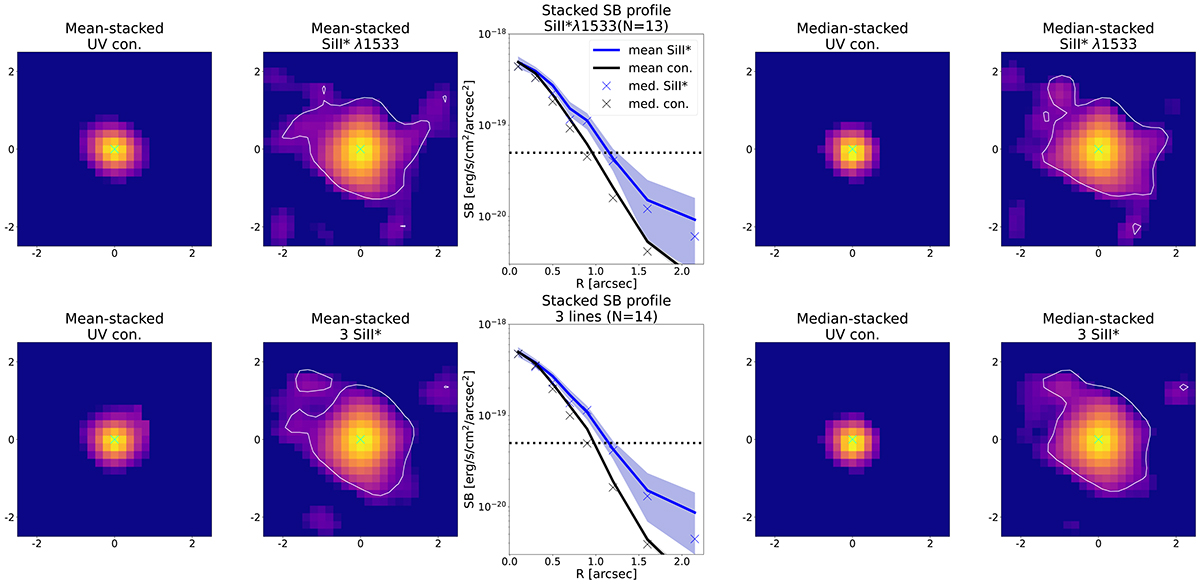
Stacking results. From left to right, we show the mean-stacked UV continuum image, the mean-stacked Si II* emission image (5 arcsec each), the mean surface brightness profiles, the median-stacked UV continuum image, and the median-stacked Si II* emission image. The top and bottom panels represent stacking results of the Si II* λ1533 line (N = 13) and those of all Si II* lines (22 images for 14 sources), respectively. The cyan crosses indicate the HST center. The white contours correspond to 5 × 10⁻²⁰ erg s−1 cm−2 arcsec−2, which is also shown by black dotted lines on the SB profiles. The SB profiles of the mean-stacked Si II* and UV continuum are indicated by the blue and black lines, respectively, while the median-stacked Si II* and UV continuum are shown by the blue and the black crosses, respectively. The blue and gray shades represent 1σ uncertainties of the SB for Si II* emission and UV continuum, respectively. Following Fig. 3, the SB profiles for the continuum are normalized at the innermost radius (R = ![]() ) to those for the Si II* emission. The mean and median stacked Si II* NB images show a clear extension of Si II* compared to the UV continuum on the stacked MUSE BB images, which can be confirmed with their SB profiles.
) to those for the Si II* emission. The mean and median stacked Si II* NB images show a clear extension of Si II* compared to the UV continuum on the stacked MUSE BB images, which can be confirmed with their SB profiles.
Current usage metrics show cumulative count of Article Views (full-text article views including HTML views, PDF and ePub downloads, according to the available data) and Abstracts Views on Vision4Press platform.
Data correspond to usage on the plateform after 2015. The current usage metrics is available 48-96 hours after online publication and is updated daily on week days.
Initial download of the metrics may take a while.