Fig. 3.
Download original image
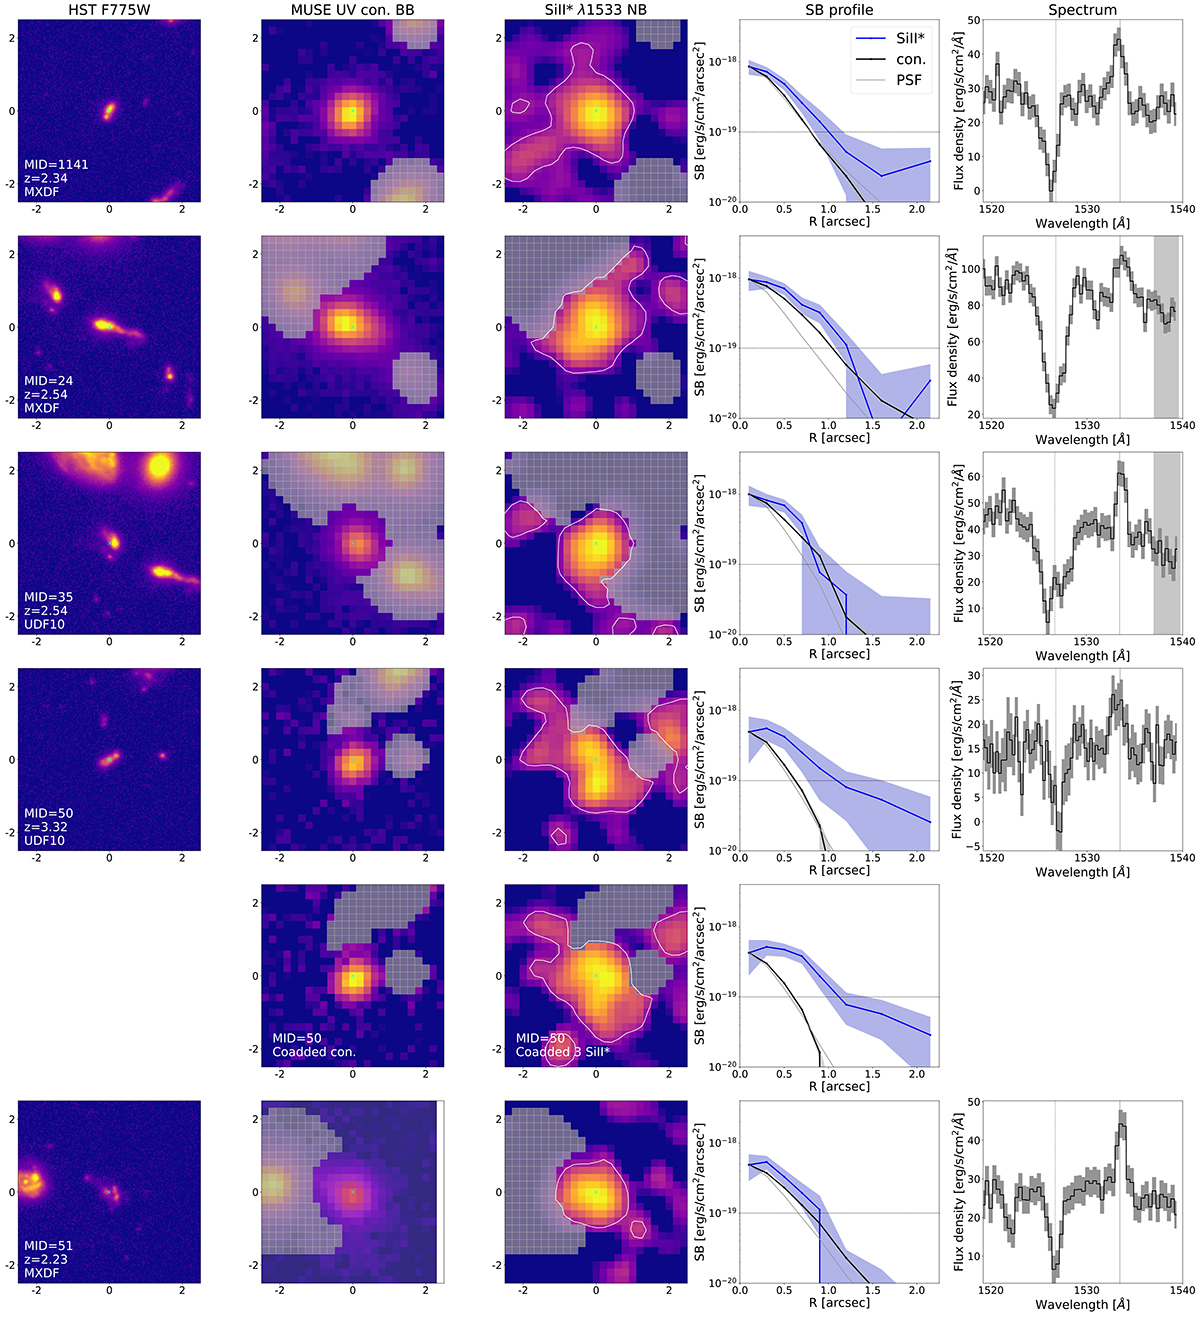
Images and spectra for Si II* halos. (From left to right) The HST image, MUSE UV-continuum BB image, MUSE Si II* NB image, SB profile, and Si II* spectrum for the five sources with Si II* halo detections. Each row (except the fifth) shows the Si II* λ1533 line for a different object. The fifth row shows a coadded result of three Si II* lines for MID = 50 at z = 3.32, whose three Si II* lines (Si II* λ1265, Si II* λ1309, and Si II* λ1533) are covered with MUSE. The image size is five arcsec. The gray shades indicate masked spaxels. For presentation purposes, NB images are smoothed with a Gaussian kernel with σ = 1.5 spaxel. The white contours correspond to 1 × 10⁻¹⁹ erg s−1 cm−2 arcsec−2 (the typical 3σ SB limit in MXDF for an unresolved emission; Bacon et al. 2023). The cyan crosses indicate the HST center. The SB profiles of the UV continuum (black lines) are normalized at the innermost radius (R = ![]() ) to the SB profiles of Si II* (blue lines). The blue and gray shades represent 1σ uncertainties of the SB for Si II* emission and UV continuum, respectively. The gray solid and dotted lines show the SB profile of the PSF normalized at the center and the typical 3σ SB limit of the NBs in MXDF for unresolved emission, respectively. The rest-frame reference spectrum and its 1σ uncertainty are shown by a black solid line and a gray shade, respectively. The reference spectrum for each object is chosen from those extracted by five different methods to have high S/N in Bacon et al. (2023). The wavelengths for Si II* emission and Si II absorption lines are indicated by gray solid and dotted lines, respectively. MID = 24 and MID = 35 have broad C IVλλ1548, 1550 lines, which are masked by gray shades at the red edge of the spectrum. The MUSE Si II* NB images show a clear extension of Si II* compared to the UV continuum on the MUSE BB images, which can be confirmed with their SB profiles.
) to the SB profiles of Si II* (blue lines). The blue and gray shades represent 1σ uncertainties of the SB for Si II* emission and UV continuum, respectively. The gray solid and dotted lines show the SB profile of the PSF normalized at the center and the typical 3σ SB limit of the NBs in MXDF for unresolved emission, respectively. The rest-frame reference spectrum and its 1σ uncertainty are shown by a black solid line and a gray shade, respectively. The reference spectrum for each object is chosen from those extracted by five different methods to have high S/N in Bacon et al. (2023). The wavelengths for Si II* emission and Si II absorption lines are indicated by gray solid and dotted lines, respectively. MID = 24 and MID = 35 have broad C IVλλ1548, 1550 lines, which are masked by gray shades at the red edge of the spectrum. The MUSE Si II* NB images show a clear extension of Si II* compared to the UV continuum on the MUSE BB images, which can be confirmed with their SB profiles.
Current usage metrics show cumulative count of Article Views (full-text article views including HTML views, PDF and ePub downloads, according to the available data) and Abstracts Views on Vision4Press platform.
Data correspond to usage on the plateform after 2015. The current usage metrics is available 48-96 hours after online publication and is updated daily on week days.
Initial download of the metrics may take a while.