Fig. 2.
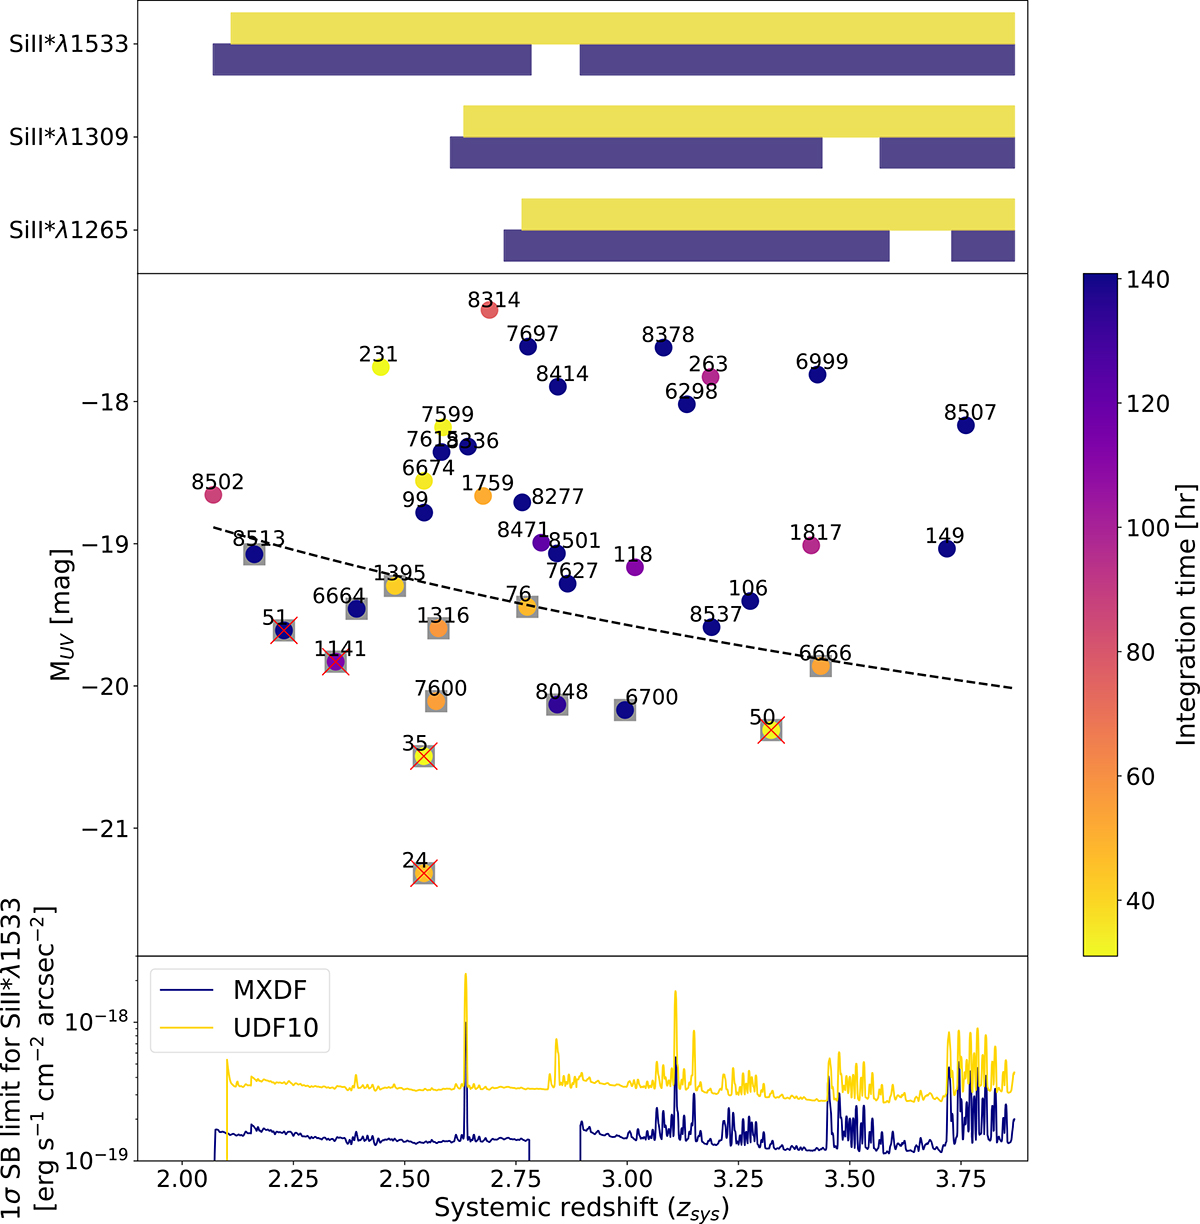
Download original image
Redshift distribution of our sample. (Top) Redshift ranges covered for the Si II* λ1265, 1309, and 1533 lines. Dark blue and yellow indicate mxdf and udf-10, respectively. The gaps between the dark blue bars are the AO gap (see Sect. 2.1). (Middle) MUV and zsys distribution of our sample with MUSE IDs. The color bar at the right indicates the integration time. The stacked subsample is enclosed by gray squares. The MUV corresponding to mUV = 26.0 (magnitude cut for the stacking sample) at each redshift is shown by the black dashed line. The individually detected Si II* halos are indicated by red crosses (see Sect. 3.2 ). (Bottom) 1σ SB limits for Si II* λ1533 in mxdf (dark blue) and udf-10 (yellow), which are converted from the median surface brightness limits on the sensitivity table in Bacon et al. (2023) using the narrow band widths for Si II* λ1533 for given redshifts (see Sect. 3.1). The Si II* halos tend to have bright MUV.
Current usage metrics show cumulative count of Article Views (full-text article views including HTML views, PDF and ePub downloads, according to the available data) and Abstracts Views on Vision4Press platform.
Data correspond to usage on the plateform after 2015. The current usage metrics is available 48-96 hours after online publication and is updated daily on week days.
Initial download of the metrics may take a while.