Fig. B.1.
Download original image
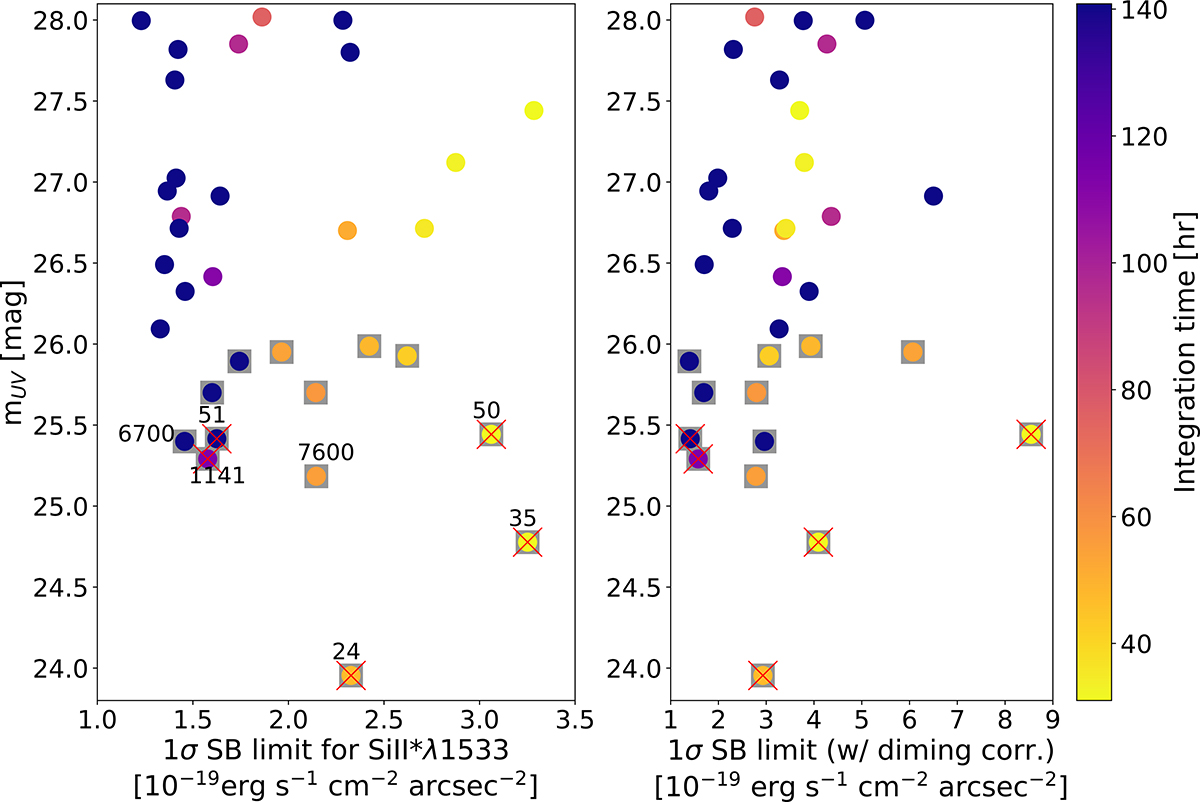
Distributions of 1σ SB limits of Si II* λ1533 and apparent UV magnitudes for our sample. The left panel shows 1σ SB limits on a 1-arcsec2 scale for the Si II* λ1533 NBs, while the right panel shows 1σ SB limits multiplied by (1+z)4/(1+z1141)4 to account for the effect of cosmic dimming in a relative manner. The color bar indicates the integration time. The stacked subsample is enclosed by gray squares, and the individually detected Si II* halos are indicated by red crosses (see Sect. 3.2 ). The MUSE IDs for the seven objects with mUV ≲ 25.5, which are brighter than the faintest individually detected halo (ID=51) are shown in the left panel. Detection rates of halos are expected to depend on the SB limits of the data set, but the panels do not show any clear trend, likely due to the limited sample size and different sample properties.
Current usage metrics show cumulative count of Article Views (full-text article views including HTML views, PDF and ePub downloads, according to the available data) and Abstracts Views on Vision4Press platform.
Data correspond to usage on the plateform after 2015. The current usage metrics is available 48-96 hours after online publication and is updated daily on week days.
Initial download of the metrics may take a while.