Fig. 12.
Download original image
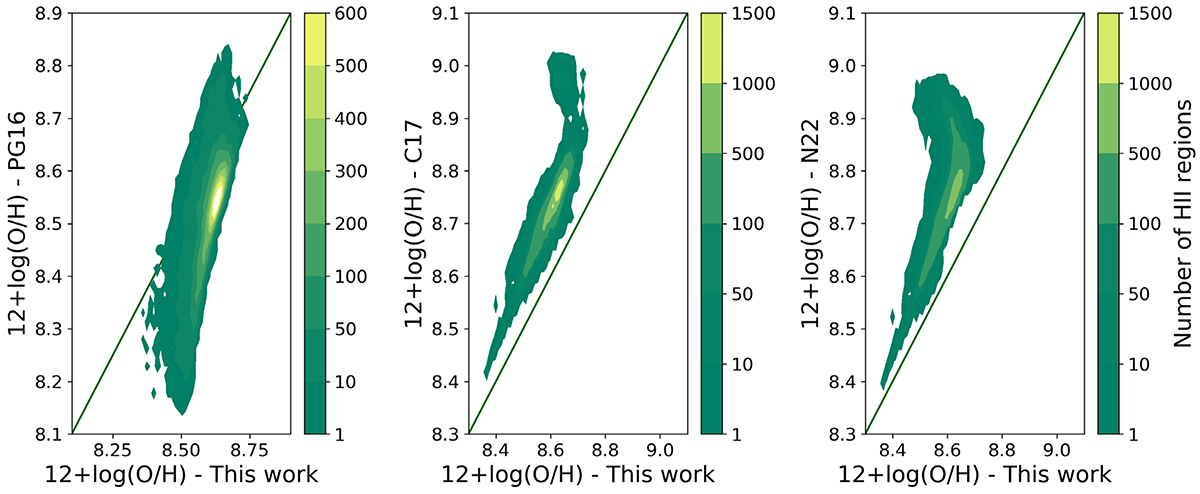
Comparison between indirect metallicity estimates based on our calibration and on PG16, C17 and N22 calibrations (respectively: left, central, and right panels) for all H II regions in the PHANGS–MUSE sample. For each figure, the colourbar describes the contour lines of the metallicity distribution. The solid line indicates the 1:1 relation.
Current usage metrics show cumulative count of Article Views (full-text article views including HTML views, PDF and ePub downloads, according to the available data) and Abstracts Views on Vision4Press platform.
Data correspond to usage on the plateform after 2015. The current usage metrics is available 48-96 hours after online publication and is updated daily on week days.
Initial download of the metrics may take a while.