Fig. 6.
Download original image
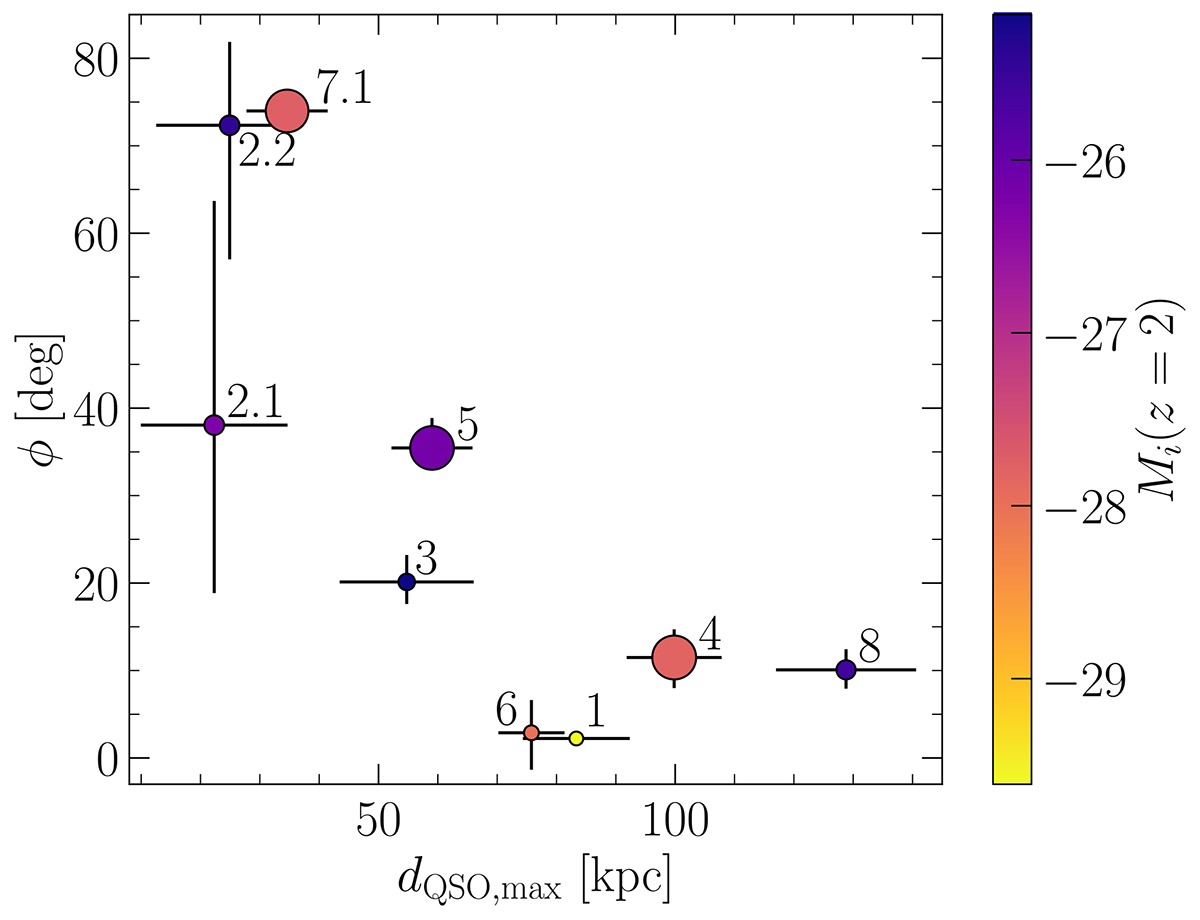
Angle between the Lyα nebula semi-major axis and the line connecting the two quasars, ϕ versus the maximum distance between the bright quasar in each pair and its associated Lyα nebula 2σ isophote, dQSO, max. The data points are color coded following Mi(z = 2) of the associated quasar, while their sizes indicate the projected distance between the quasars in each pair. The quasar IDs are displayed next to the respective data points.
Current usage metrics show cumulative count of Article Views (full-text article views including HTML views, PDF and ePub downloads, according to the available data) and Abstracts Views on Vision4Press platform.
Data correspond to usage on the plateform after 2015. The current usage metrics is available 48-96 hours after online publication and is updated daily on week days.
Initial download of the metrics may take a while.