Open Access
Fig. A.6.
Download original image
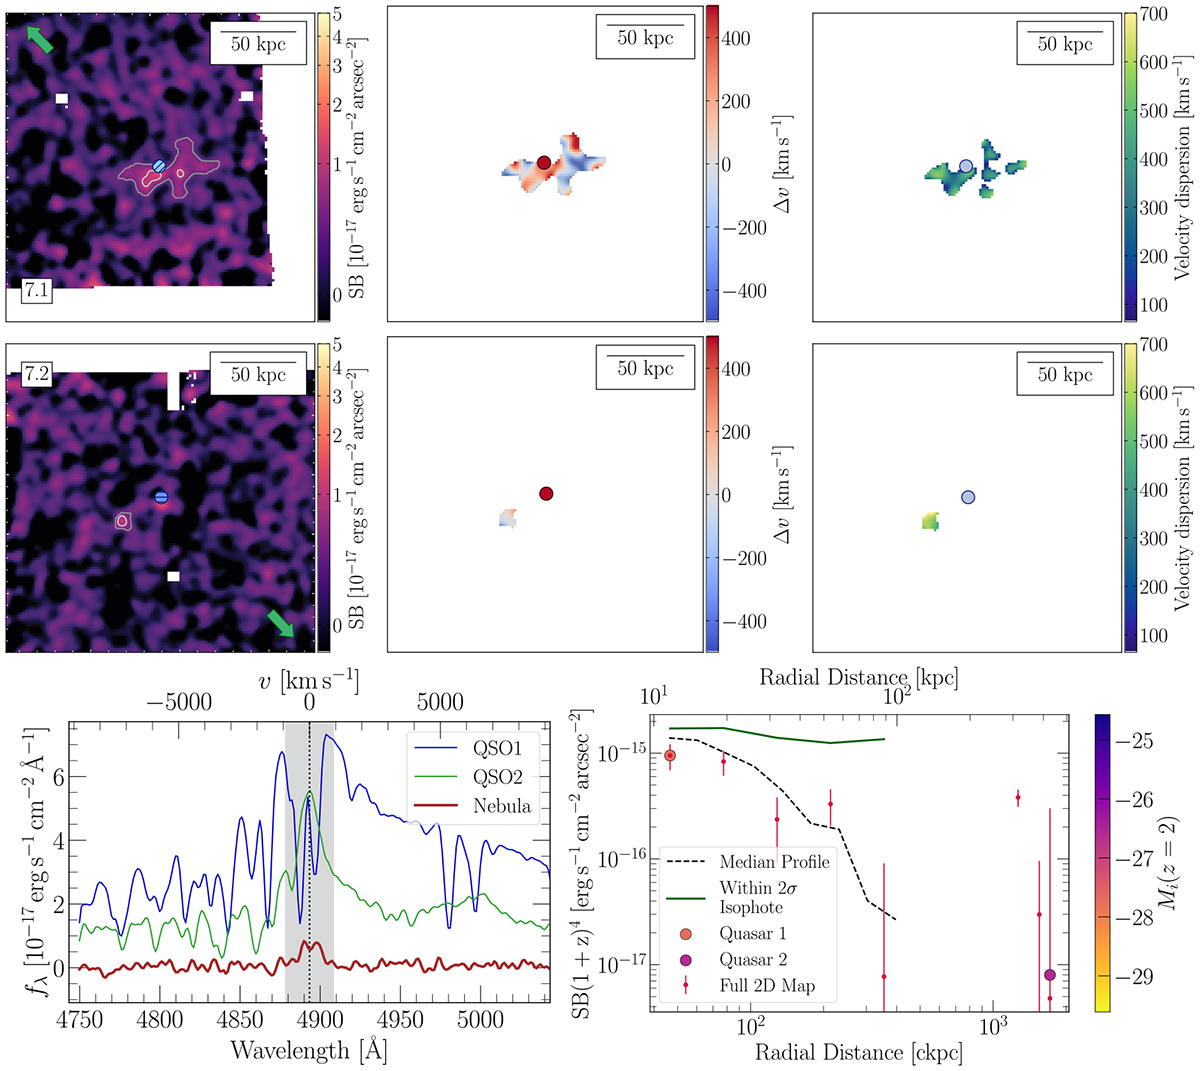
Same as Fig. 3 but for quasar pair 7. As this is a wide pair, maps are presented for each quasar individually. Top row: Lyα surface brightness map, line velocity and velocity dispersion for quasar 7.1. Middle row: Lyα surface brightness map, line velocity and velocity dispersion for quasar 7.2.
Current usage metrics show cumulative count of Article Views (full-text article views including HTML views, PDF and ePub downloads, according to the available data) and Abstracts Views on Vision4Press platform.
Data correspond to usage on the plateform after 2015. The current usage metrics is available 48-96 hours after online publication and is updated daily on week days.
Initial download of the metrics may take a while.