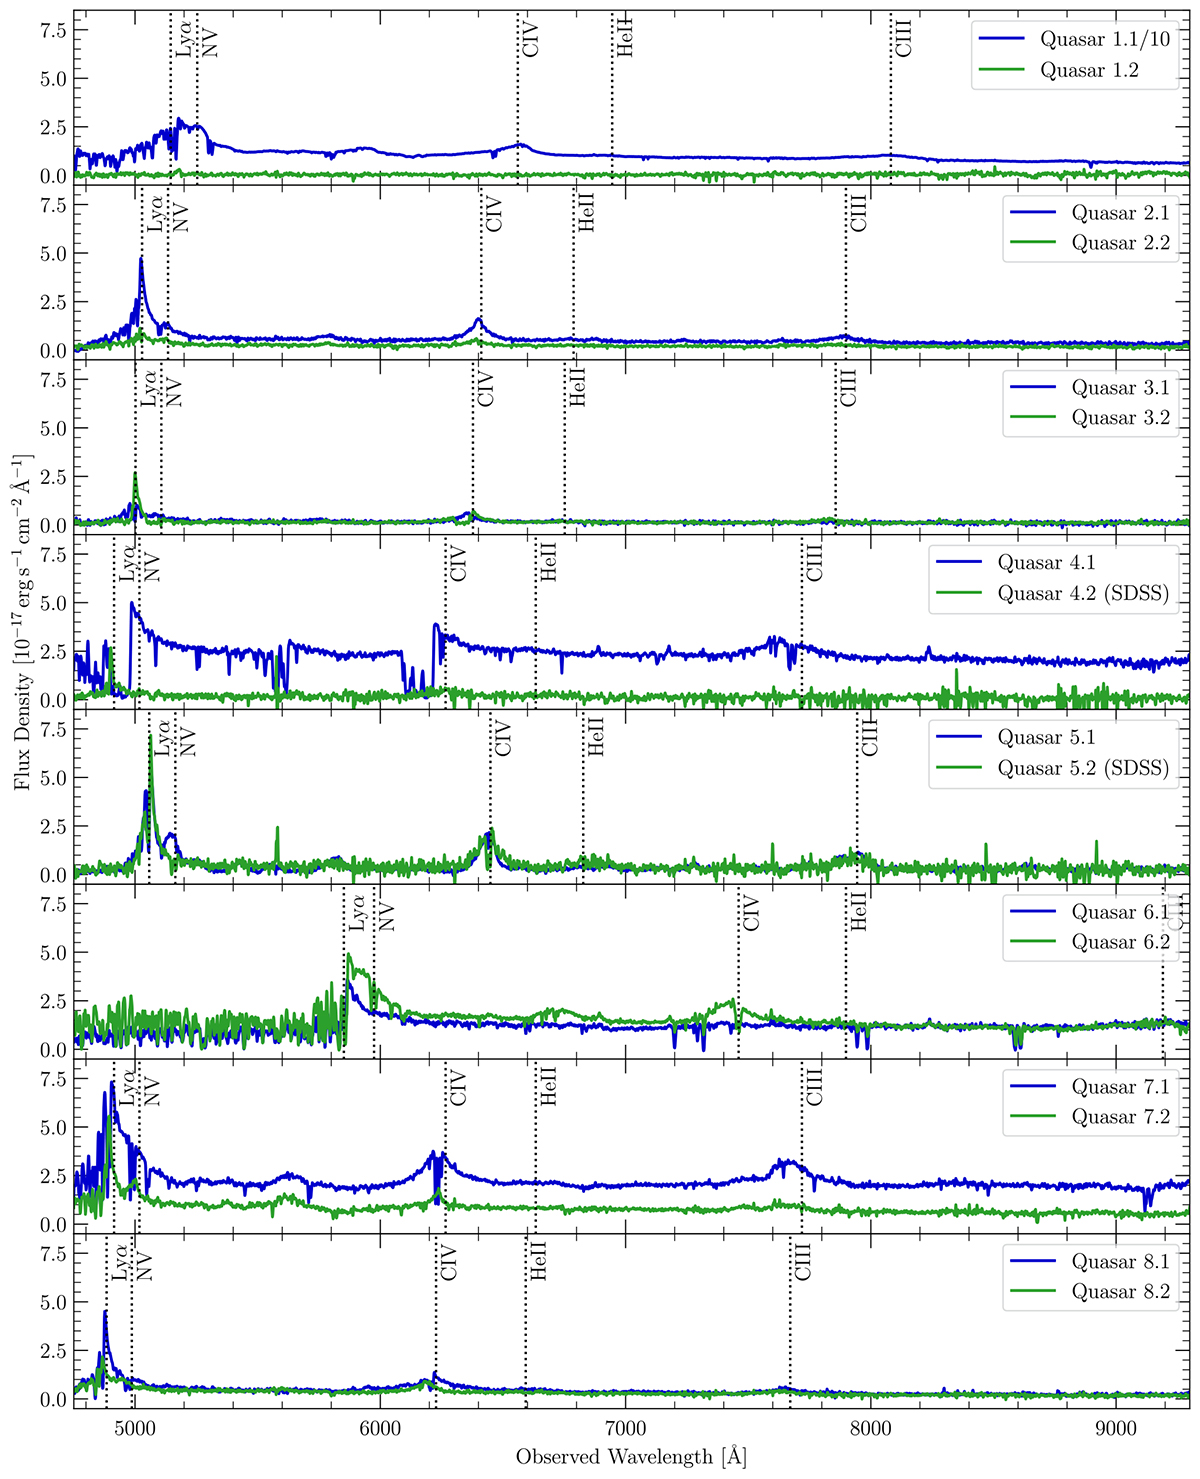
Fig. 1.
Download original image
Eight targeted quasar pairs. Each panel shows the spectra for the two AGNs extracted either from the final MUSE data cubes in an aperture of 3″or available from SDSS. Vertical dotted lines indicate the location of key emission lines at the SDSS redshift of the brighter quasar. The spectrum of quasar 1.1 is scaled down by a factor of 10. The mean noise per channel in the MUSE data at the respective wavelength of Lyα is ![]() .
.
Current usage metrics show cumulative count of Article Views (full-text article views including HTML views, PDF and ePub downloads, according to the available data) and Abstracts Views on Vision4Press platform.
Data correspond to usage on the plateform after 2015. The current usage metrics is available 48-96 hours after online publication and is updated daily on week days.
Initial download of the metrics may take a while.