Fig. 5.
Download original image
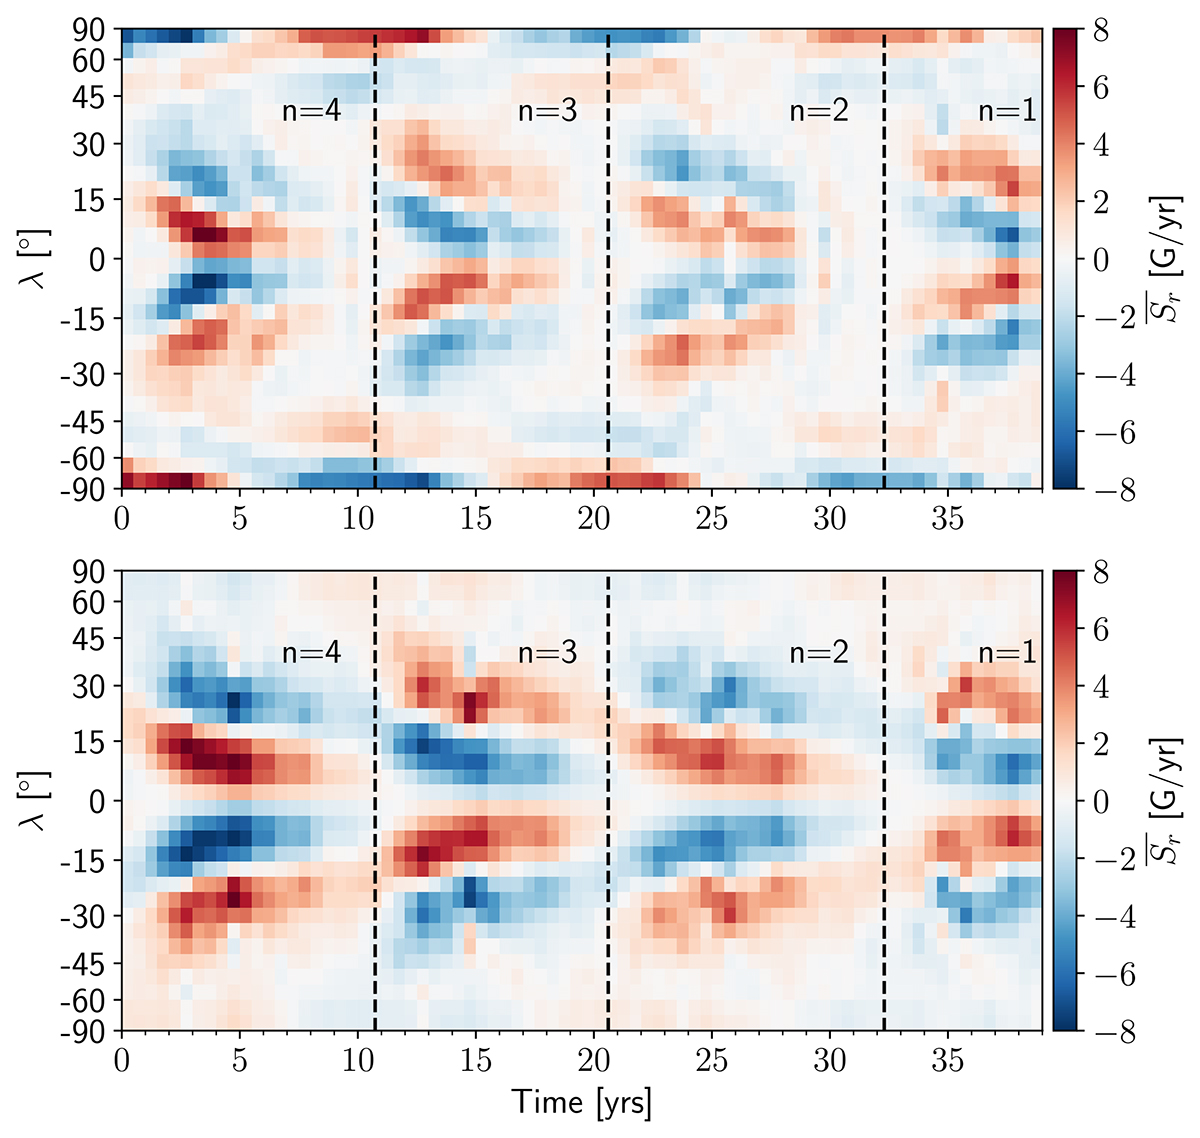
Time-latitude diagrams of the mean surface radial source term, ![]() , inferred from the surface radial field and SFT model (top) and from the surface toroidal field and emergence model for m = 0 (bottom); see the main text. The vertical dotted lines indicate the cycle start times as determined by the procedure outlined in Sect. 2.
, inferred from the surface radial field and SFT model (top) and from the surface toroidal field and emergence model for m = 0 (bottom); see the main text. The vertical dotted lines indicate the cycle start times as determined by the procedure outlined in Sect. 2.
Current usage metrics show cumulative count of Article Views (full-text article views including HTML views, PDF and ePub downloads, according to the available data) and Abstracts Views on Vision4Press platform.
Data correspond to usage on the plateform after 2015. The current usage metrics is available 48-96 hours after online publication and is updated daily on week days.
Initial download of the metrics may take a while.