Open Access
Fig. 2.
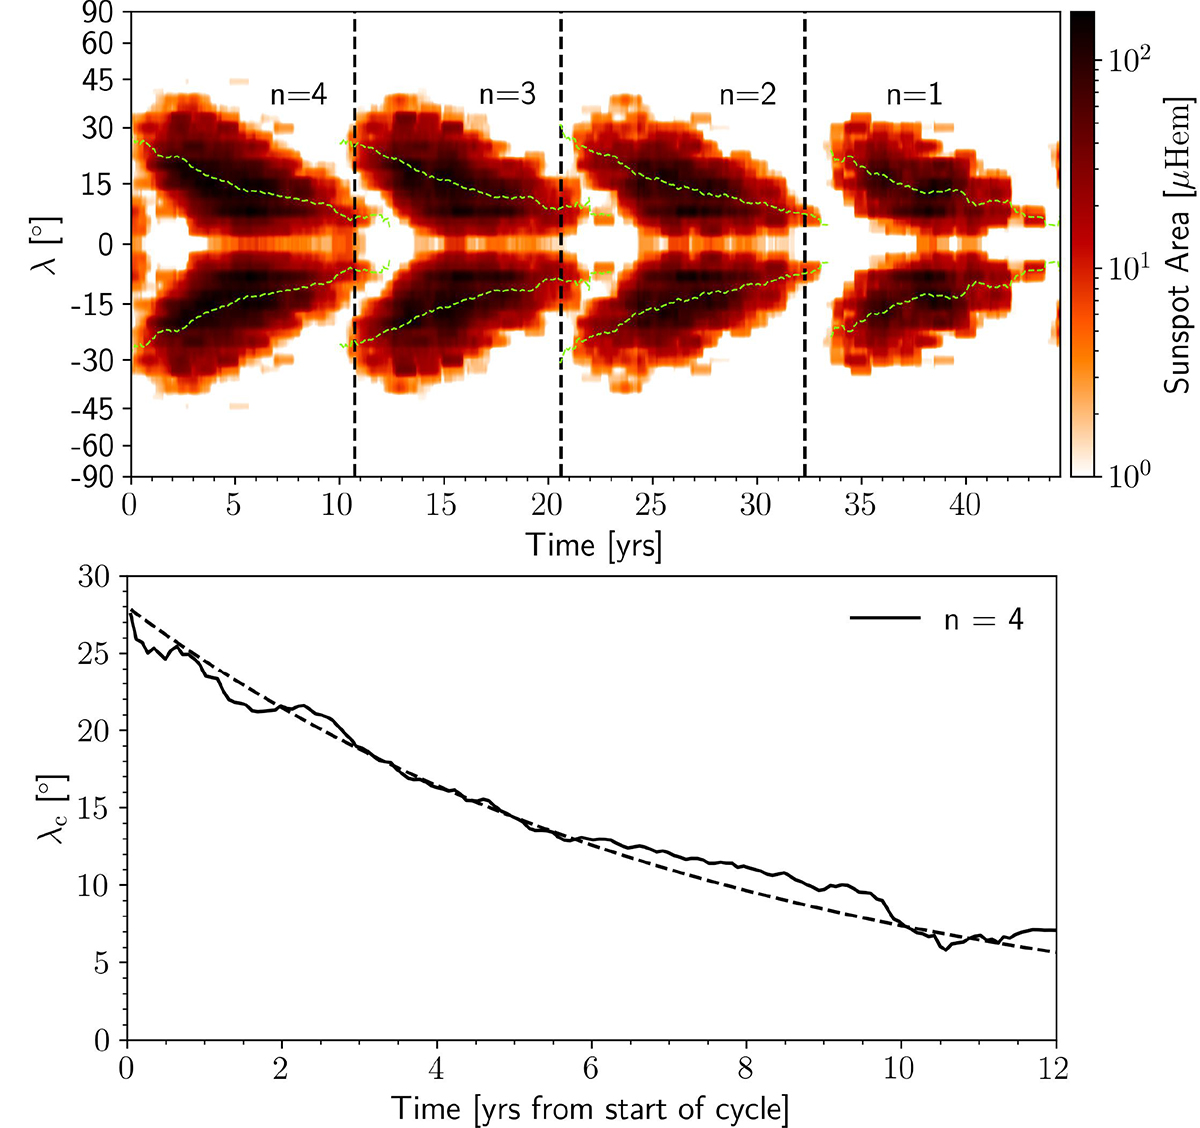
Download original image
Cycle average of the sunspot area (top) and centroid latitudes as a function of time starting from t0 (bottom). The dashed green lines represent the centroid latitude of the sunspot zone (Eq. (1)) and the vertical dashed lines the reference start times of the cycles (see the main text).
Current usage metrics show cumulative count of Article Views (full-text article views including HTML views, PDF and ePub downloads, according to the available data) and Abstracts Views on Vision4Press platform.
Data correspond to usage on the plateform after 2015. The current usage metrics is available 48-96 hours after online publication and is updated daily on week days.
Initial download of the metrics may take a while.