Fig. 2.
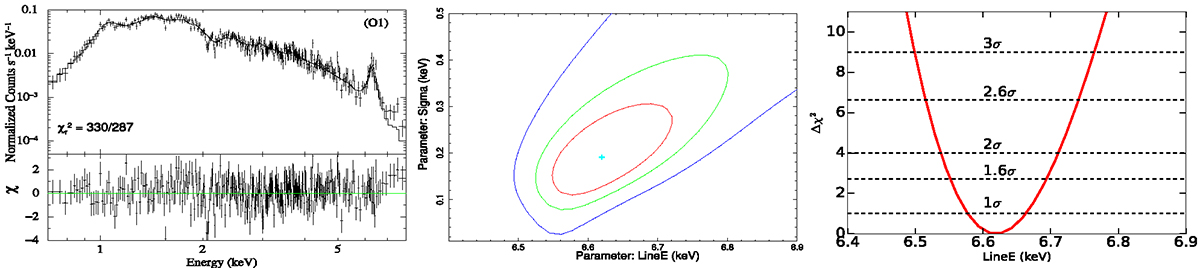
Download original image
Analysis of O1 spectrum of binary AGN 4C+37.11 using model M1. Left: Best-fitted O1 spectrum in the 0.7−7.5 keV energy range. Points and solid line in the top panel denote the data and model while the model fitted residual is shown in the bottom panel. The line width of the Fe Kα line is ∼0.19 ± 0.05 keV. Middle: Confidence contour between the line energy and line width. The red, green, and blue contours correspond 1σ, 2σ, and 3σ levels. Right: Δχ2 confidence contour of the Fe Kα line energy. The dashed horizontal lines represent different confidence levels of the detection.
Current usage metrics show cumulative count of Article Views (full-text article views including HTML views, PDF and ePub downloads, according to the available data) and Abstracts Views on Vision4Press platform.
Data correspond to usage on the plateform after 2015. The current usage metrics is available 48-96 hours after online publication and is updated daily on week days.
Initial download of the metrics may take a while.