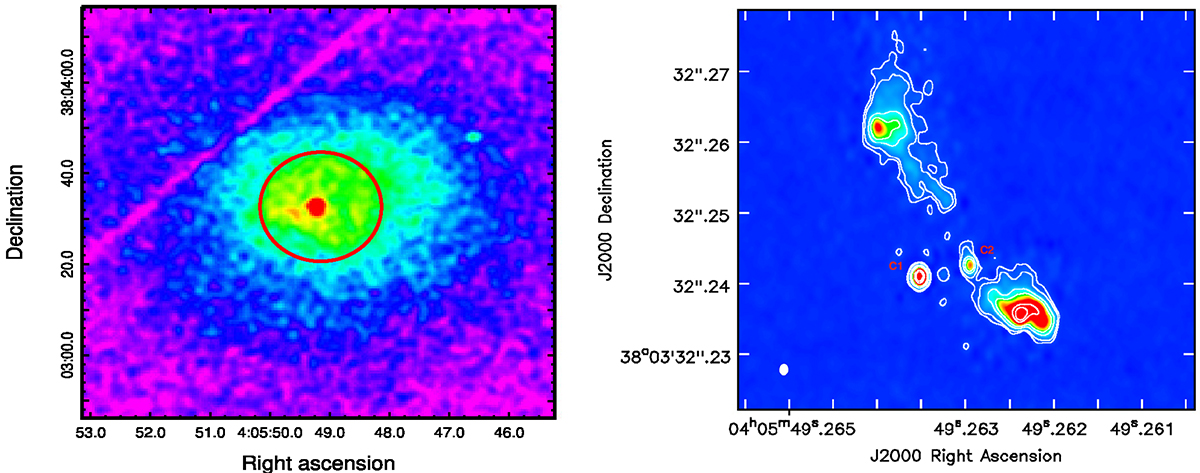
Fig. 1.
Download original image
Image of the core of 4C+37.11 in X-rays and radio wavelength. Left: The X-ray image obtained from Chandra observation. The red circle is the region of 12″ considered for spectral analysis. Right: Naturally weighted VLBA map of the zoomed-in central core region at 8 GHz, where the beam size along the jet direction is 1.26 mas (Bansal et al. 2017). The central core components are designated C1 and C2 with negative contours in magenta. The contour levels are 0.6, 1.25, 5, 10, 40, and 60% of the peak flux density 0.0792 Jy/beam.
Current usage metrics show cumulative count of Article Views (full-text article views including HTML views, PDF and ePub downloads, according to the available data) and Abstracts Views on Vision4Press platform.
Data correspond to usage on the plateform after 2015. The current usage metrics is available 48-96 hours after online publication and is updated daily on week days.
Initial download of the metrics may take a while.