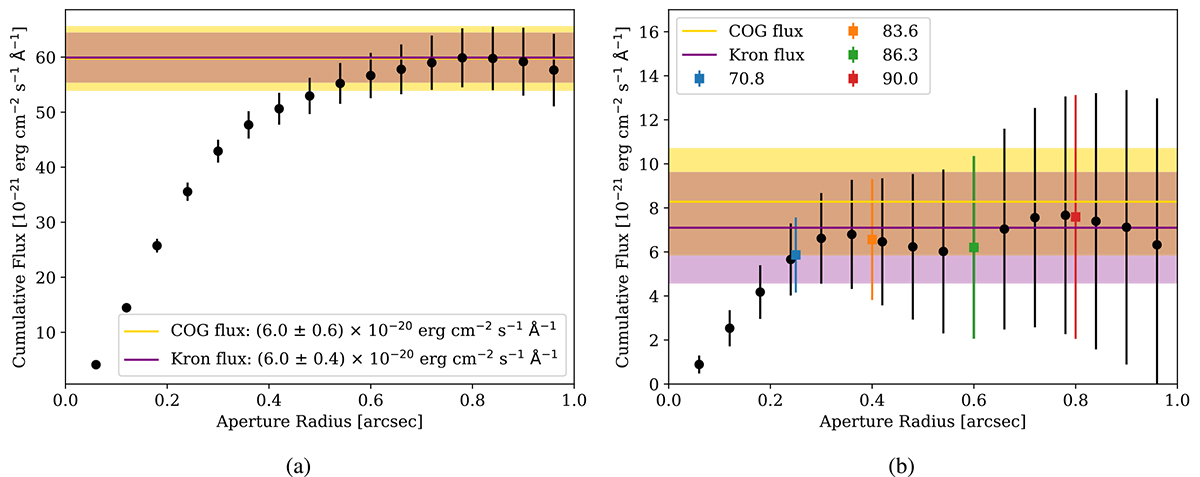
Fig. 2.
Download original image
Growth curve for galaxies GW (a) and GE (b). The black points show the resulting flux with background and shot-noise uncertainties. The Kron flux is represented in purple with the shaded 68% confidence region. The growth curve flux is marked in yellow with the shaded 68% confidence region. In panel b, the colored squares represent the flux observed inside the apertures that encircle 70.8%, 83.6%, 86.3%, and 90.0% of the total energy emitted by a point-like source.
Current usage metrics show cumulative count of Article Views (full-text article views including HTML views, PDF and ePub downloads, according to the available data) and Abstracts Views on Vision4Press platform.
Data correspond to usage on the plateform after 2015. The current usage metrics is available 48-96 hours after online publication and is updated daily on week days.
Initial download of the metrics may take a while.