Fig. 1.
Download original image
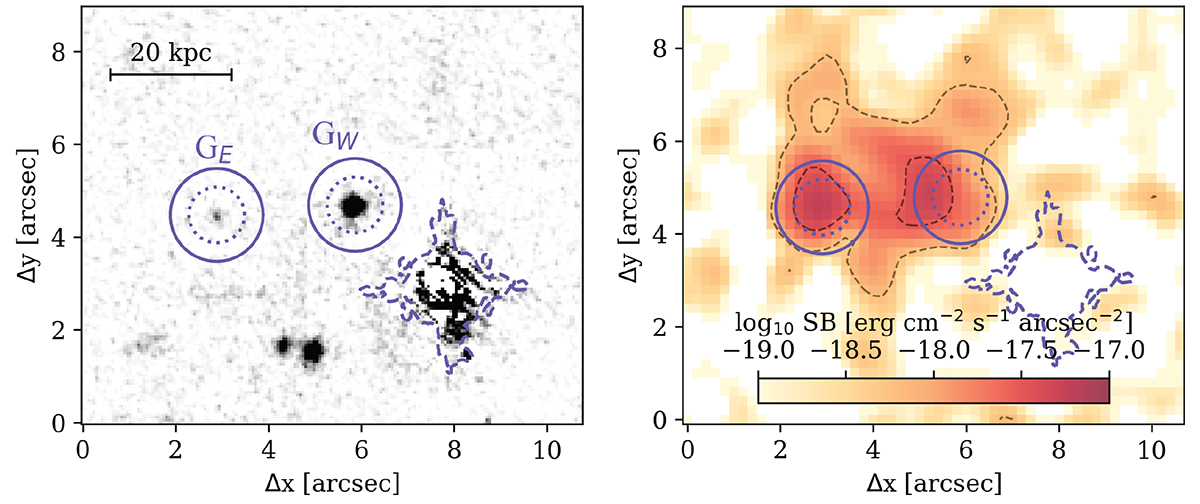
HST data of the two continuum-emitting sources GE and GW inside the Lyα-emitting nebula observed with MUSE. Left: HST WFC3/F160W observation with the subtracted quasar PSF. The two sources GE and GW are indicated by the purple circular apertures of ![]() radius (dotted line) and 1″ (solid line) centered on the galaxies. Next to GW, the dashed purple line marks the original PSF of the quasar. Right: Lyα surface-brightness map obtained from the MUSE cube and smoothed with a Gaussian 2D kernel with
radius (dotted line) and 1″ (solid line) centered on the galaxies. Next to GW, the dashed purple line marks the original PSF of the quasar. Right: Lyα surface-brightness map obtained from the MUSE cube and smoothed with a Gaussian 2D kernel with ![]() . The dashed gray lines delimit the 1σ (6 × 10⁻¹⁹ erg s−1 cm−2 arcsec−2) and 5σ surface-brightness levels. The purple circles of radius
. The dashed gray lines delimit the 1σ (6 × 10⁻¹⁹ erg s−1 cm−2 arcsec−2) and 5σ surface-brightness levels. The purple circles of radius ![]() and 1″ surrounding the continuum-detected sources are reproduced to better show the positions of the two galaxies relative to the Lyα clumps (CW and CE), and the position of the quasar is again marked by the dashed purple line.
and 1″ surrounding the continuum-detected sources are reproduced to better show the positions of the two galaxies relative to the Lyα clumps (CW and CE), and the position of the quasar is again marked by the dashed purple line.
Current usage metrics show cumulative count of Article Views (full-text article views including HTML views, PDF and ePub downloads, according to the available data) and Abstracts Views on Vision4Press platform.
Data correspond to usage on the plateform after 2015. The current usage metrics is available 48-96 hours after online publication and is updated daily on week days.
Initial download of the metrics may take a while.