Open Access
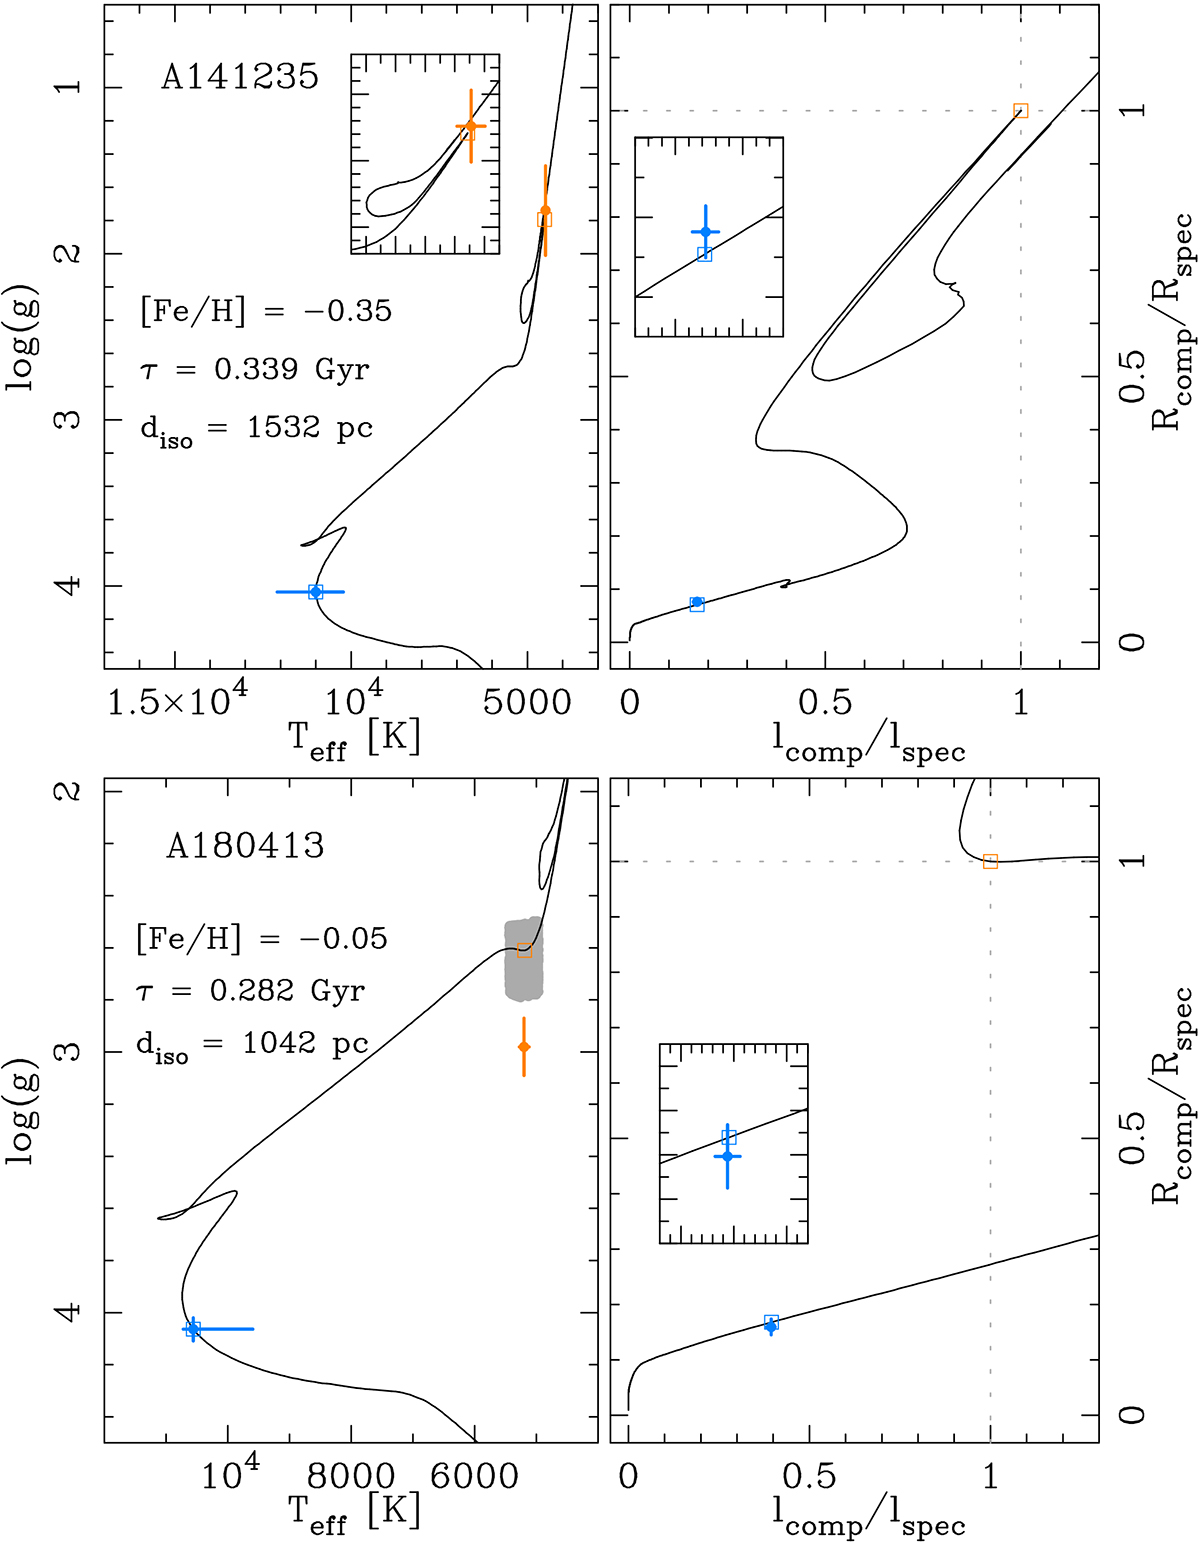
Fig. 5.
Download original image
Same as Figs. 3 and A.3, but for SB1 systems (top: A141235; bottom: A180413) and on different planes. We only show Teff − log(g) (left) and lcomp/lspec − Rcomp/Rspec (right). On the latter, the spectroscopic component is shown without errors, and set by definition to (1.0;1.0). Flux ratios refer to the ASAS V band.
Current usage metrics show cumulative count of Article Views (full-text article views including HTML views, PDF and ePub downloads, according to the available data) and Abstracts Views on Vision4Press platform.
Data correspond to usage on the plateform after 2015. The current usage metrics is available 48-96 hours after online publication and is updated daily on week days.
Initial download of the metrics may take a while.