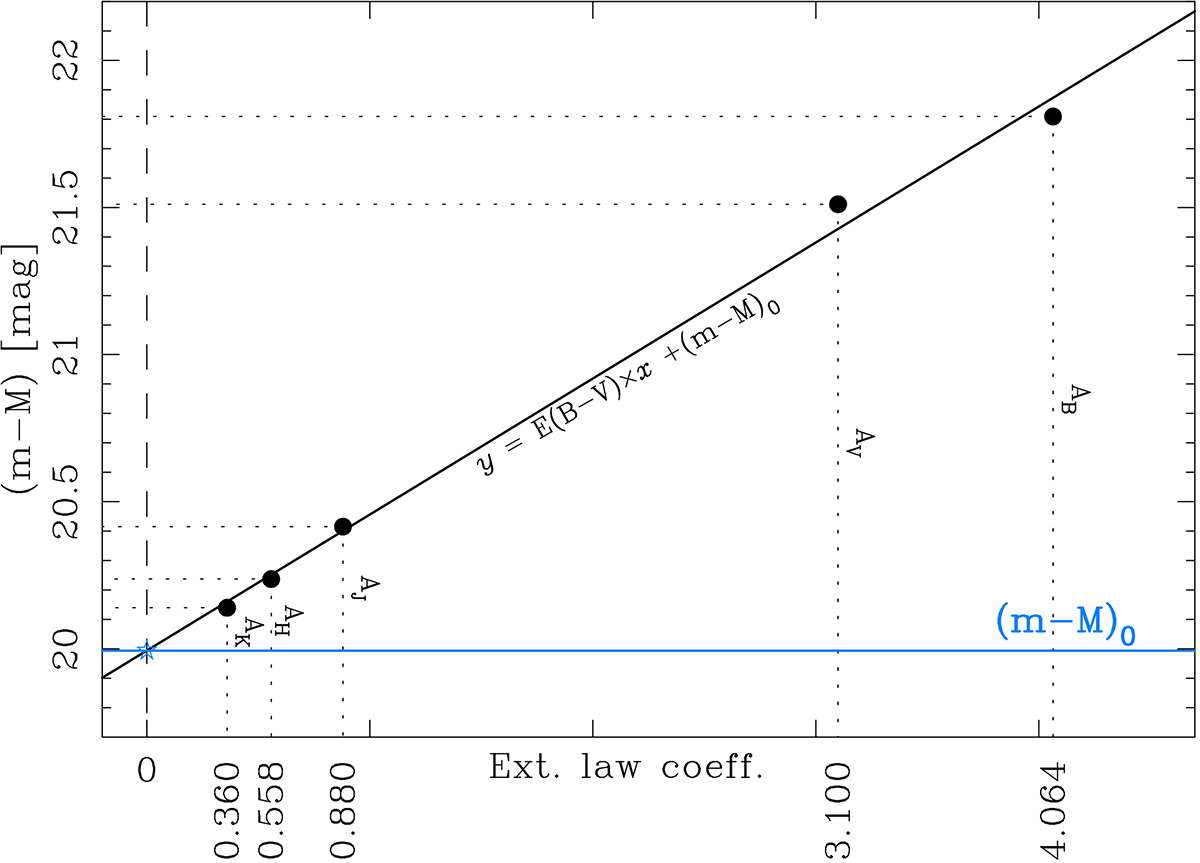
Fig. 2.
Download original image
Graphical explanation of distance and reddening determination method. The distance moduli (m − M)λ, calculated from observed magnitudes and synthetic photometry in different bands, are plotted (black dots) as a function of their corresponding law coefficient, by which we define the applied extinction law. The slope and the intercept of the fitted line (solid black) are the values of E(B − V) and reddening-free distance modulus (m − M)0, respectively. The (m − M)0 level is shown in blue. Differences between (m − M)0 and each (m − M)λ represent extinction values Aλ in each band (in mag), and they are also labelled.
Current usage metrics show cumulative count of Article Views (full-text article views including HTML views, PDF and ePub downloads, according to the available data) and Abstracts Views on Vision4Press platform.
Data correspond to usage on the plateform after 2015. The current usage metrics is available 48-96 hours after online publication and is updated daily on week days.
Initial download of the metrics may take a while.