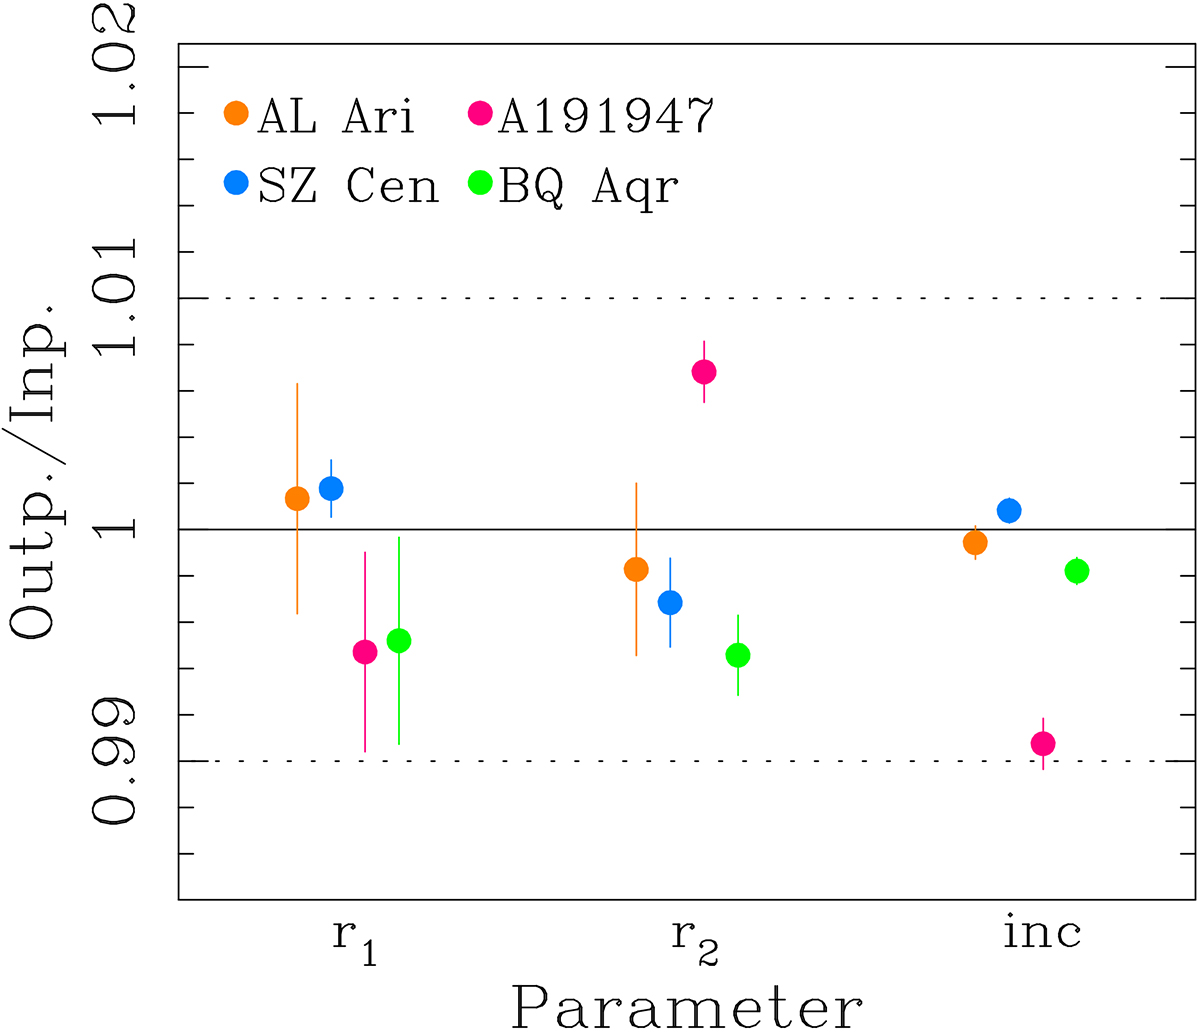
Fig. B.1.
Download original image
Comparison of results of the JKTEBOP analysis of synthetic light curves with the input values, for a sample of crucial parameters (fractional radii and inclination). The plot shows ratio of the output to the input value, with scaled uncertainties calculated with Monte-Carlo approach (Task 8). Each colour codes the analysis of a synthetic curve based on one of the selected systems. The dashed vertical lines mark ±1% deviation from the input. In every case, including those with the largest oblateness, JKTEBOP reproduced the input values with accuracy better than 0.7%.
Current usage metrics show cumulative count of Article Views (full-text article views including HTML views, PDF and ePub downloads, according to the available data) and Abstracts Views on Vision4Press platform.
Data correspond to usage on the plateform after 2015. The current usage metrics is available 48-96 hours after online publication and is updated daily on week days.
Initial download of the metrics may take a while.