Fig. 14.
Download original image
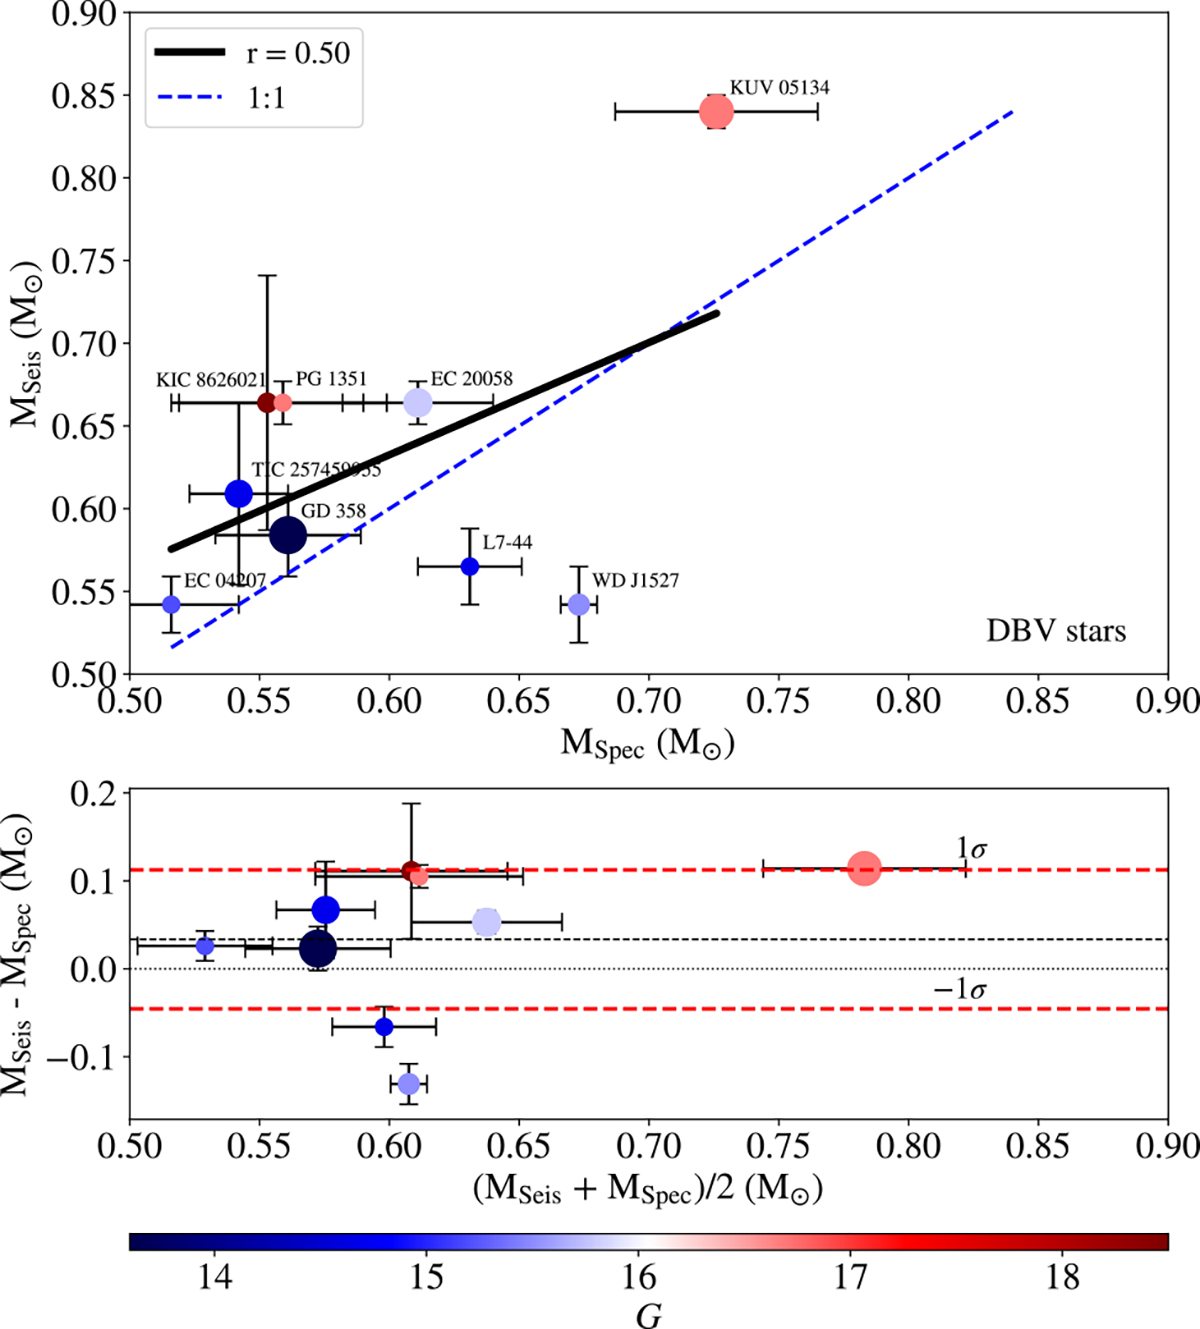
Comparison of stellar masses for DBV stars. Upper panel: Dispersion diagram displaying the comparison between the spectroscopic and asteroseismological masses for DBVs (see Table B.2). All the stars are identified by their names. Bottom panel: Corresponding Bland-Pearson diagram. The meaning of the different lines in both panels is the same as in Fig. 8.
Current usage metrics show cumulative count of Article Views (full-text article views including HTML views, PDF and ePub downloads, according to the available data) and Abstracts Views on Vision4Press platform.
Data correspond to usage on the plateform after 2015. The current usage metrics is available 48-96 hours after online publication and is updated daily on week days.
Initial download of the metrics may take a while.