Fig. 2.
Download original image
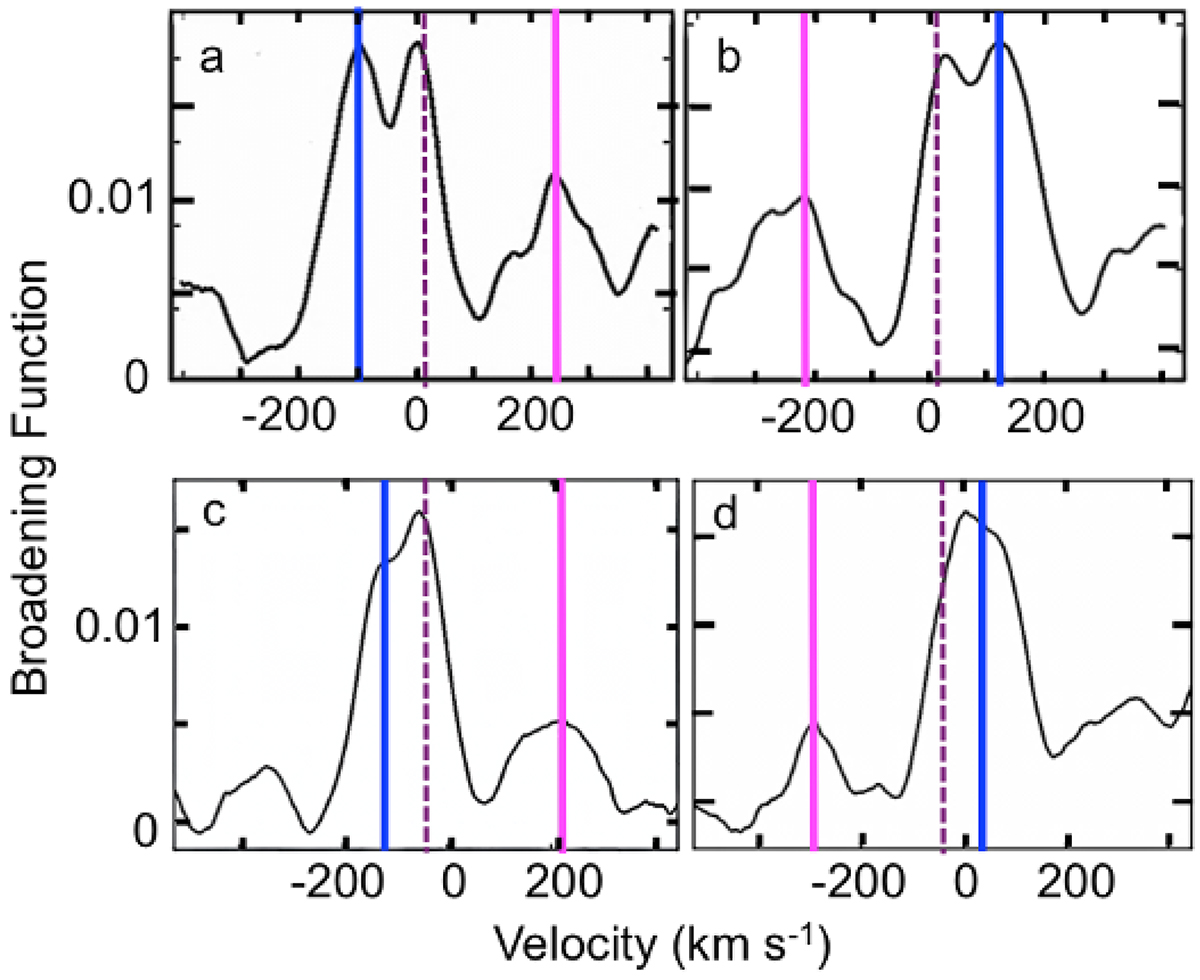
Examples of broadening function curves. The orbital velocity of the primary components is marked with a blue line and that of the secondary components with a magenta line. The systemic velocity is indicated by the dashed line. (a) BF Vel phase 0.28, 2020 Nov. 1, exp. time = 240 s. (b) BF Vel phase 0.73, 2020 Nov. 2, exp. time = 240 s. (c) RR Lep phase 0.25, 2020 Dec. 1, exp. time = 240 s. (d) RR Lep phase 0.76, 2020 Nov. 3, exp. time = 420 s.
Current usage metrics show cumulative count of Article Views (full-text article views including HTML views, PDF and ePub downloads, according to the available data) and Abstracts Views on Vision4Press platform.
Data correspond to usage on the plateform after 2015. The current usage metrics is available 48-96 hours after online publication and is updated daily on week days.
Initial download of the metrics may take a while.