Open Access
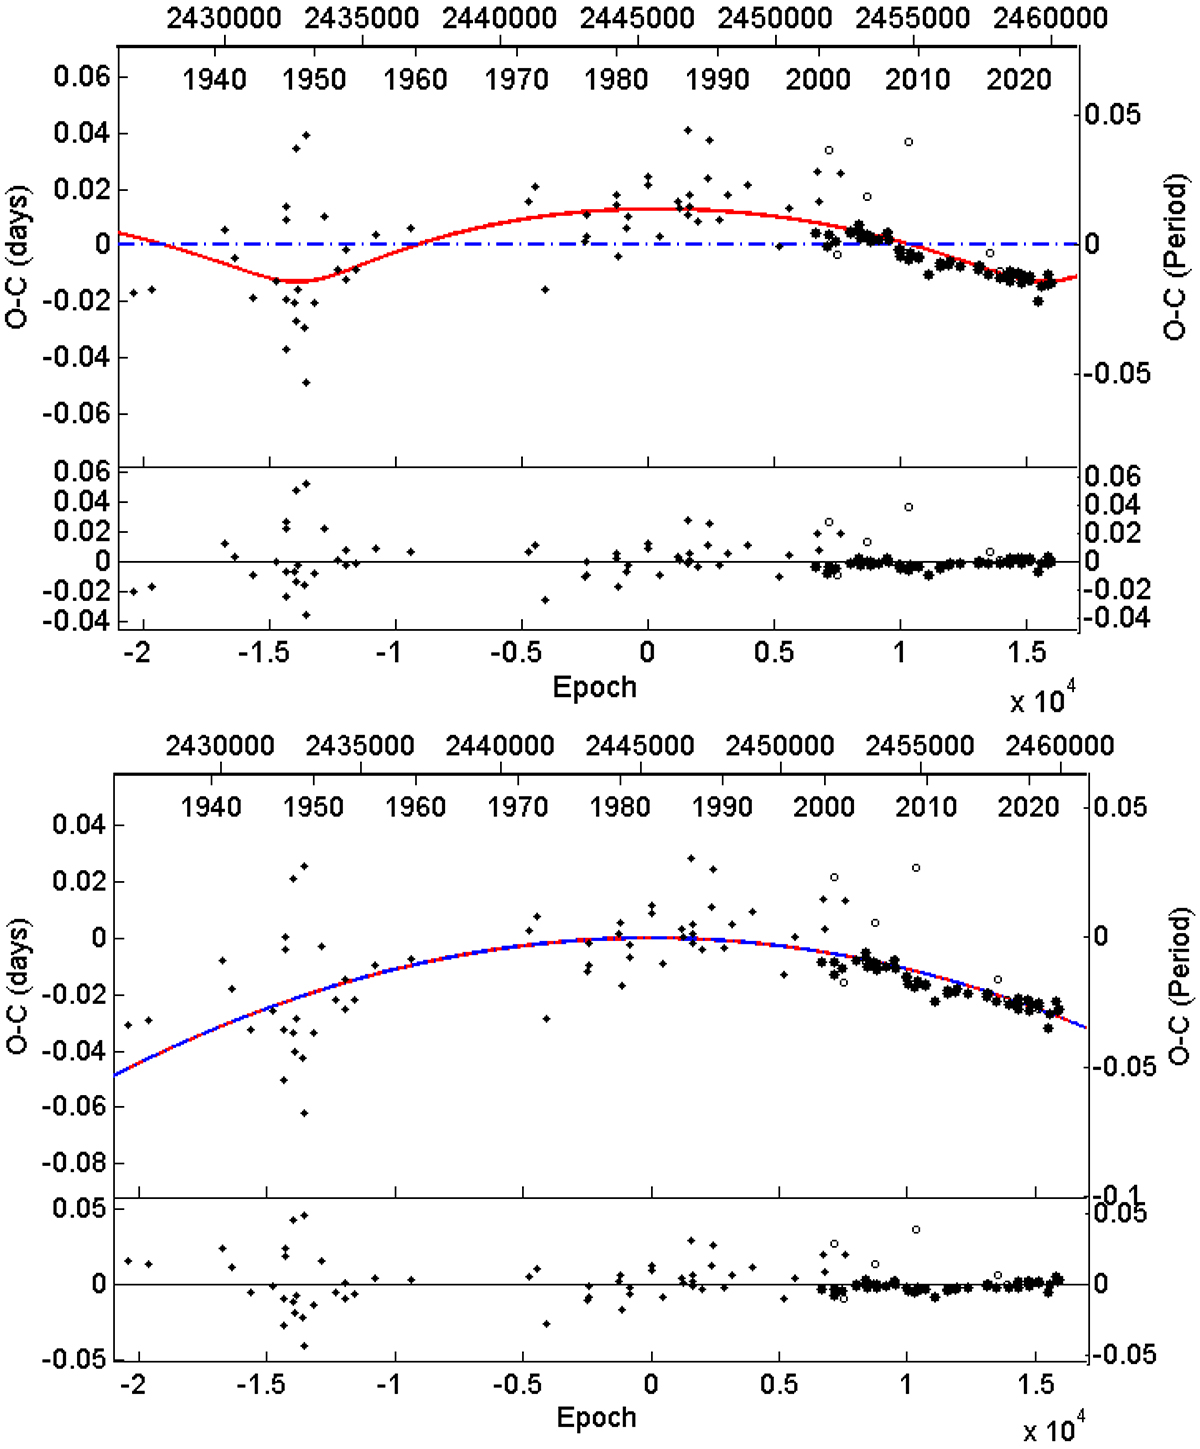
Fig. 18.
Download original image
Fitting of a LITE curve (upper plot) and of a downward parabola (lower plot) on the ToM of RR Lep. The bigger the symbol the bigger the statistical weight. Open and filled symbols denote the primary and secondary ToM, respectively. Lower panels show the residuals of each solution.
Current usage metrics show cumulative count of Article Views (full-text article views including HTML views, PDF and ePub downloads, according to the available data) and Abstracts Views on Vision4Press platform.
Data correspond to usage on the plateform after 2015. The current usage metrics is available 48-96 hours after online publication and is updated daily on week days.
Initial download of the metrics may take a while.