Fig. 17.
Download original image
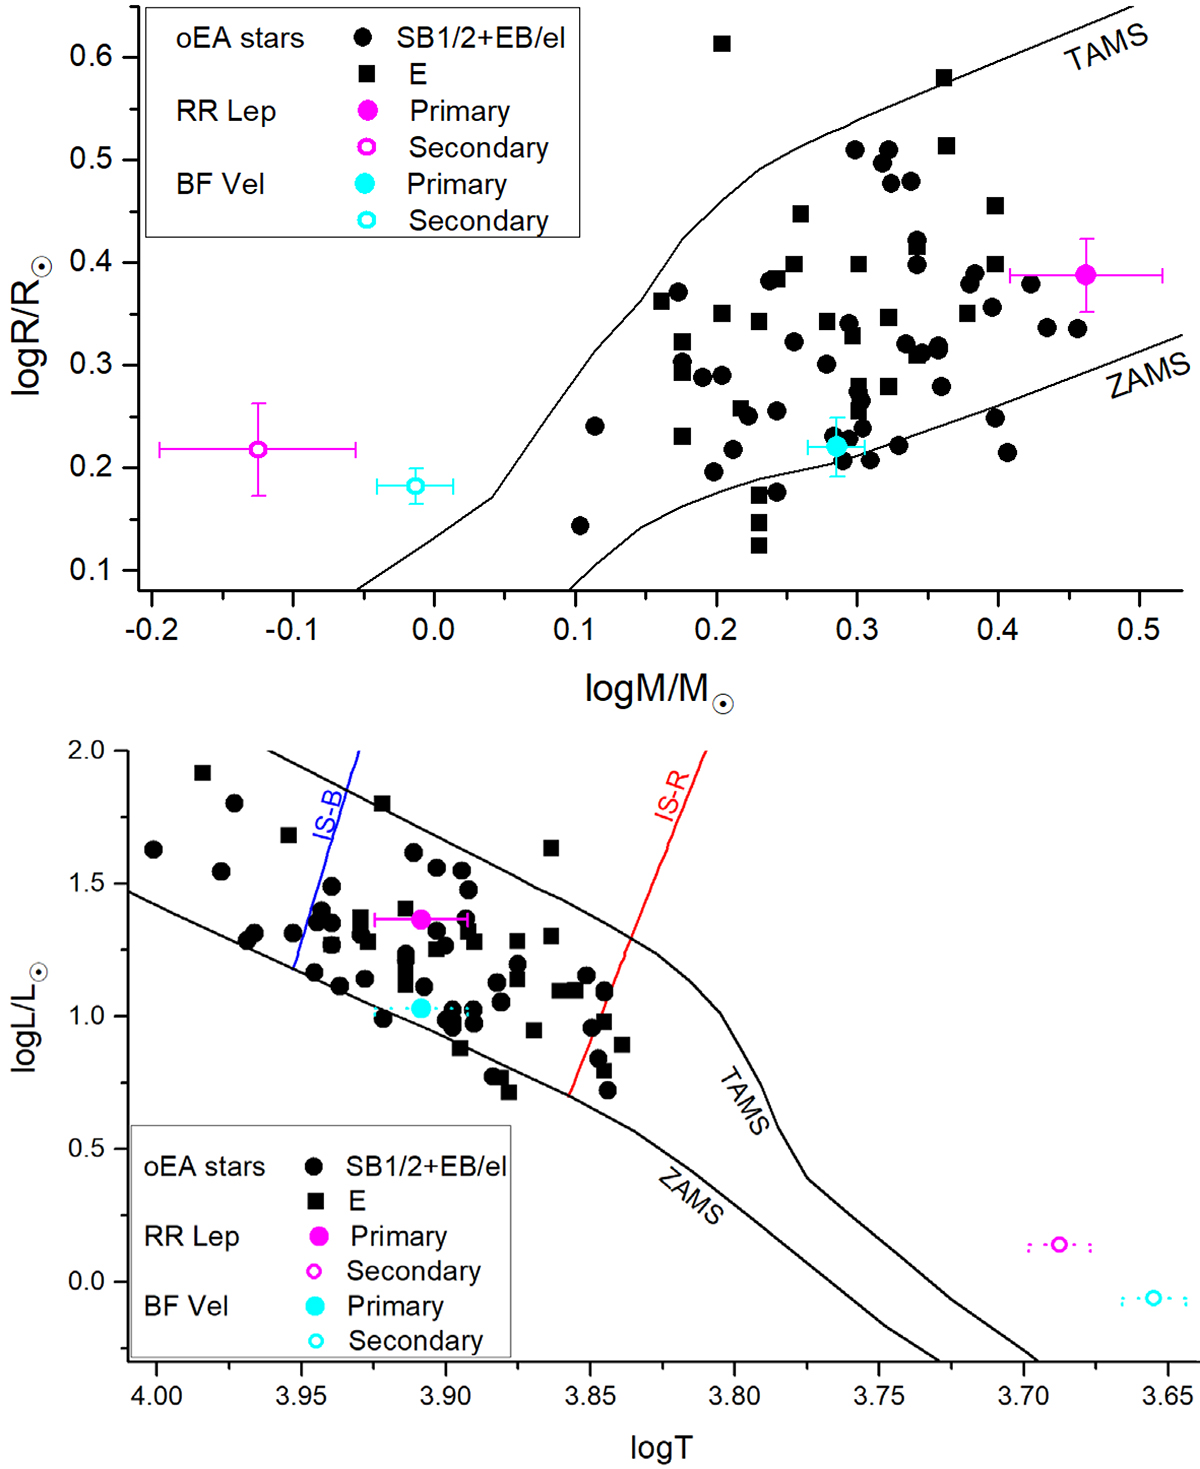
Mass–radius (top panel) and Hertzsprung–Russell (bottom panel) evolutionary diagrams. In both diagrams, the black symbols denote the δ Scuti members of oEA stars that belong either to spectroscopic single- or double-lined (SB1 or SB2) and eclipsing (EB) or ellipsoidal (el) systems (dots) or only to eclipsing systems (squares). The sample was mainly gathered from Liakos & Niarchos (2017). Magenta and cyan symbols refer to the primary (filled) and secondary (open) components of RR Lep and BF Vel, respectively. Solid black lines indicate the ZAMS and TAMS limits and the coloured solid lines (B = blue, R = red) the boundaries of the instability strip (IS; Soydugan et al. 2006b).
Current usage metrics show cumulative count of Article Views (full-text article views including HTML views, PDF and ePub downloads, according to the available data) and Abstracts Views on Vision4Press platform.
Data correspond to usage on the plateform after 2015. The current usage metrics is available 48-96 hours after online publication and is updated daily on week days.
Initial download of the metrics may take a while.